29
/
en
AIzaSyAYiBZKx7MnpbEhh9jyipgxe19OcubqV5w
April 1, 2024
73575
Australia
AUS
true
2
1
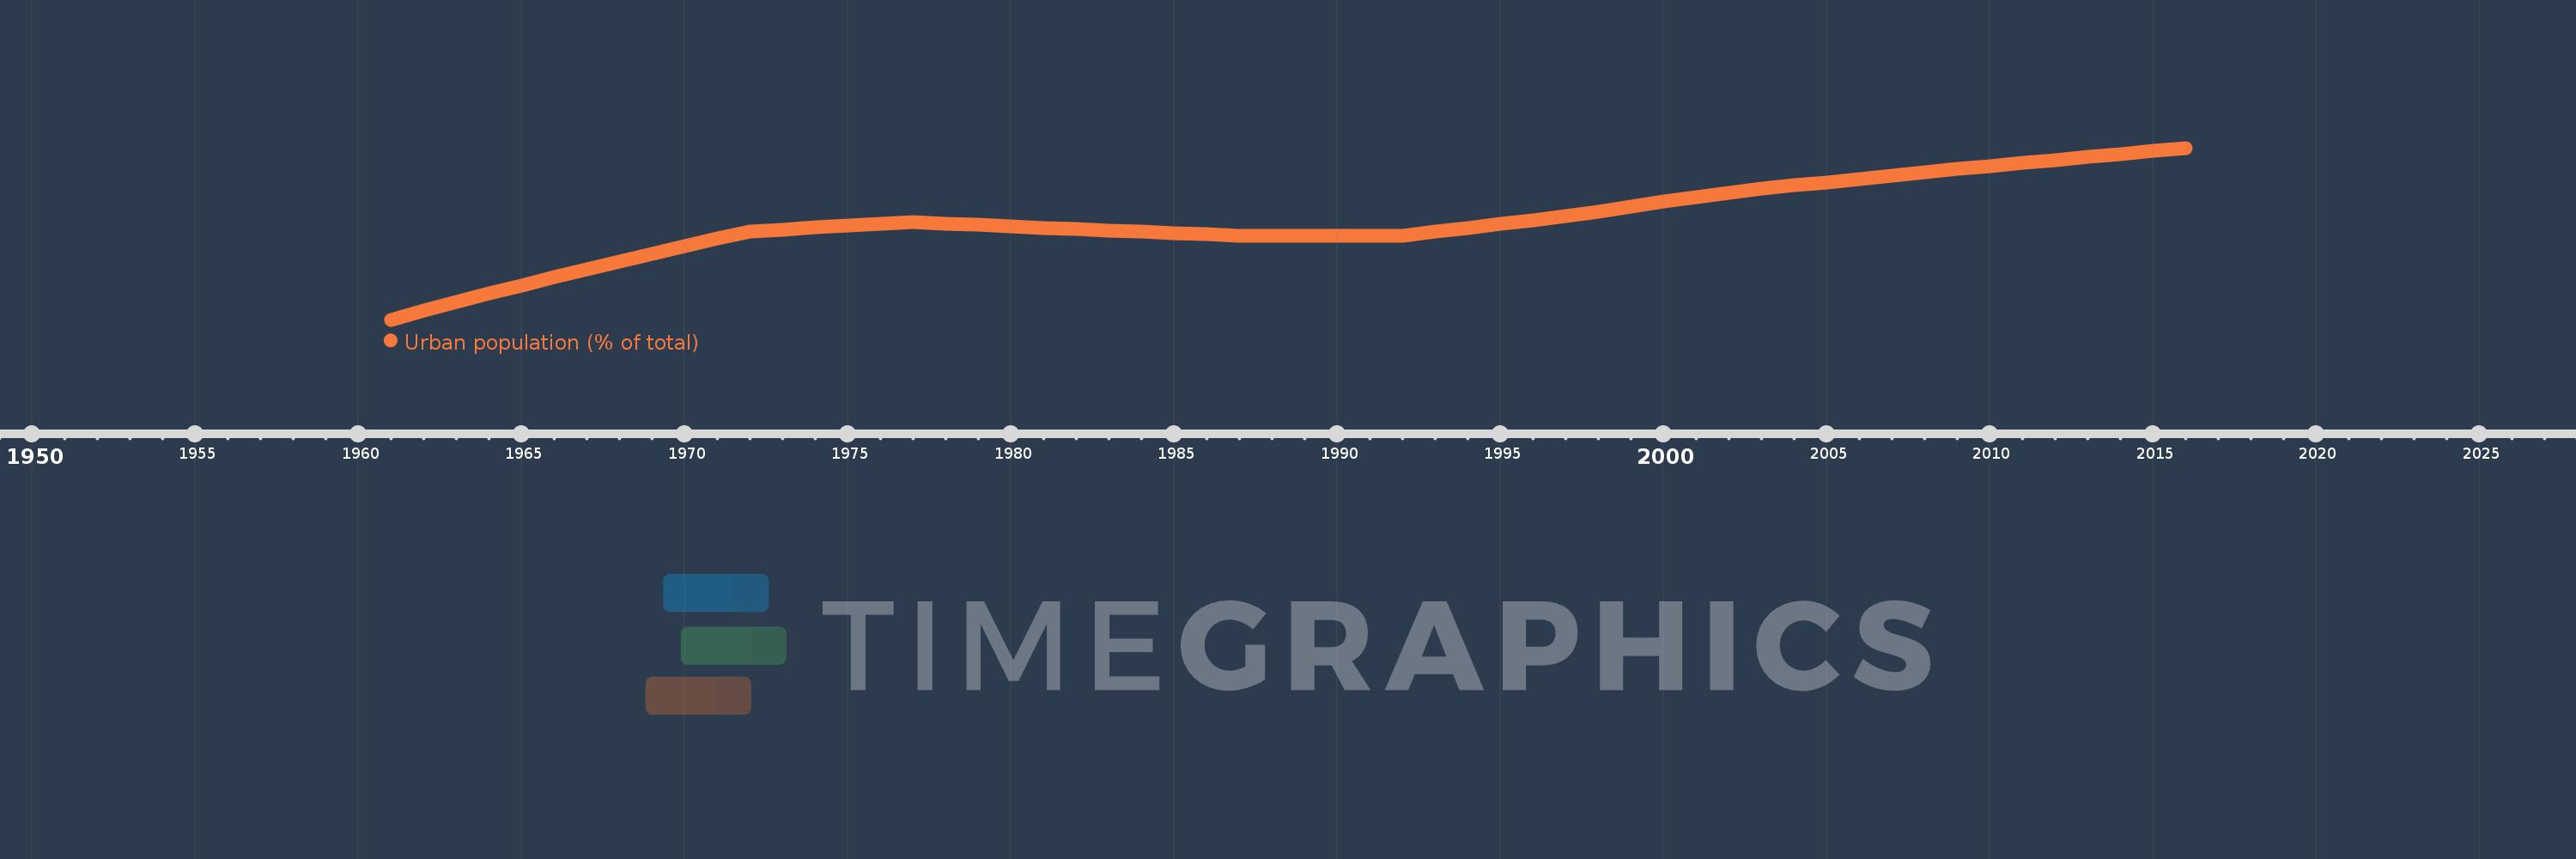
Urban population (% of total)
2016,2015,2014,2013,2012,2011,2010,2009,2008,2007,2006,2005,2004,2003,2002,2001,2000,1999,1998,1997,1996,1995,1994,1993,1992,1991,1990,1989,1988,1987,1986,1985,1984,1983,1982,1981,1980,1979,1978,1977,1976,1975,1974,1973,1972,1971,1970,1969,1968,1967,1966,1965,1964,1963,1962,1961
This statistics in other country:
AfghanistanAlbaniaAlgeriaAmerican SamoaAndorraAngolaAntigua and BarbudaArab WorldArgentinaArmeniaArubaAustraliaAustriaAzerbaijanBahamas, TheBahrainBangladeshBarbadosBelarusBelgiumBelizeBeninBermudaBhutanBoliviaBosnia and HerzegovinaBotswanaBrazilBritish Virgin IslandsBrunei DarussalamBulgariaBurkina FasoBurundiCabo VerdeCambodiaCameroonCanadaCaribbean small statesCayman IslandsCentral African RepublicCentral Europe and the BalticsChadChannel IslandsChileChinaColombiaComorosCongo, Dem. Rep.Congo, Rep.Costa RicaCote d'IvoireCroatiaCubaCuracaoCyprusCzech RepublicDenmarkDjiboutiDominicaDominican RepublicEarly-demographic dividendEast Asia & PacificEast Asia & Pacific (excluding high income)East Asia & Pacific (IDA & IBRD countries)EcuadorEgypt, Arab Rep.El SalvadorEquatorial GuineaEritreaEstoniaEthiopiaEuro areaEurope & Central AsiaEurope & Central Asia (excluding high income)Europe & Central Asia (IDA & IBRD countries)European UnionFaroe IslandsFijiFinlandFragile and conflict affected situationsFranceFrench PolynesiaGabonGambia, TheGeorgiaGermanyGhanaGibraltarGreeceGreenlandGrenadaGuamGuatemalaGuineaGuinea-BissauGuyanaHaitiHeavily indebted poor countries (HIPC)High incomeHondurasHong Kong SAR, ChinaHungaryIBRD onlyIcelandIDA & IBRD totalIDA blendIDA onlyIDA totalIndiaIndonesiaIran, Islamic Rep.IraqIrelandIsle of ManIsraelItalyJamaicaJapanJordanKazakhstanKenyaKiribatiKorea, Dem. People’s Rep.Korea, Rep.KuwaitKyrgyz RepublicLao PDRLate-demographic dividendLatin America & Caribbean Latin America & Caribbean (excluding high income)Latin America & the Caribbean (IDA & IBRD countries)LatviaLeast developed countries: UN classificationLebanonLesothoLiberiaLibyaLiechtensteinLithuaniaLow & middle incomeLow incomeLower middle incomeLuxembourgMacao SAR, ChinaMacedonia, FYRMadagascarMalawiMalaysiaMaldivesMaliMaltaMarshall IslandsMauritaniaMauritiusMexicoMicronesia, Fed. Sts.Middle East & North AfricaMiddle East & North Africa (excluding high income)Middle East & North Africa (IDA & IBRD countries)Middle incomeMoldovaMonacoMongoliaMontenegroMoroccoMozambiqueMyanmarNamibiaNauruNepalNetherlandsNew CaledoniaNew ZealandNicaraguaNigerNigeriaNorth AmericaNorthern Mariana IslandsNorwayOECD membersOmanOther small statesPacific island small statesPakistanPalauPanamaPapua New GuineaParaguayPeruPhilippinesPolandPortugalPost-demographic dividendPre-demographic dividendPuerto RicoQatarRomaniaRussian FederationRwandaSamoaSan MarinoSao Tome and PrincipeSaudi ArabiaSenegalSerbiaSeychellesSierra LeoneSingaporeSint Maarten (Dutch part)Slovak RepublicSloveniaSmall statesSolomon IslandsSomaliaSouth AfricaSouth AsiaSouth Asia (IDA & IBRD)South SudanSpainSri LankaSt. Kitts and NevisSt. LuciaSt. Vincent and the GrenadinesSub-Saharan Africa Sub-Saharan Africa (excluding high income)Sub-Saharan Africa (IDA & IBRD countries)SudanSurinameSwazilandSwedenSwitzerlandSyrian Arab RepublicTajikistanTanzaniaThailandTimor-LesteTogoTongaTrinidad and TobagoTunisiaTurkeyTurkmenistanTurks and Caicos IslandsTuvaluUgandaUkraineUnited Arab EmiratesUnited KingdomUnited StatesUpper middle incomeUruguayUzbekistanVanuatuVenezuela, RBVietnamVirgin Islands (U.S.)West Bank and GazaWorldYemen, Rep.ZambiaZimbabwe Timeline:
This timeline shows a graph from 1961 to 2016 of Australia. No data until 1960. Number of actual observations by date: 56.
Source name:
World Development Indicators
Source organization:
United Nations, World Urbanization Prospects.
Categories, topics:
Climate Change, Urban Development
Last updated:
apr 23, 2017
Indicators value changes by year
Minimum:
81.529
jan 1, 1961
Maximum:
89.423
jan 1, 2016
At the date of observation
Value
Absolute change
Change from previous value
jan 1, 1961
81.529
+81.529
0.0%
jan 1, 1962
81.941
+0.412
0.51%
jan 1, 1963
82.337
+0.396
0.48%
jan 1, 1964
82.727
+0.39
0.47%
jan 1, 1965
83.11
+0.383
0.46%
jan 1, 1966
83.485
+0.375
0.45%
jan 1, 1967
83.855
+0.37
0.44%
jan 1, 1968
84.217
+0.362
0.43%
jan 1, 1969
84.573
+0.356
0.42%
jan 1, 1970
84.922
+0.349
0.41%
jan 1, 1971
85.265
+0.343
0.4%
jan 1, 1972
85.6
+0.335
0.39%
jan 1, 1973
85.681
+0.081
0.09%
jan 1, 1974
85.761
+0.08
0.09%
jan 1, 1975
85.841
+0.08
0.09%
jan 1, 1976
85.921
+0.08
0.09%
jan 1, 1977
86.0
+0.079
0.09%
jan 1, 1978
85.94
-0.06
-0.07%
jan 1, 1979
85.881
-0.059
-0.07%
jan 1, 1980
85.821
-0.06
-0.07%
jan 1, 1981
85.76
-0.061
-0.07%
jan 1, 1982
85.7
-0.06
-0.07%
jan 1, 1983
85.64
-0.06
-0.07%
jan 1, 1984
85.58
-0.06
-0.07%
jan 1, 1985
85.52
-0.06
-0.07%
jan 1, 1986
85.46
-0.06
-0.07%
jan 1, 1987
85.4
-0.06
-0.07%
jan 1, 1993
85.566
+0.166
0.19%
jan 1, 1994
85.748
+0.182
0.21%
jan 1, 1995
85.928
+0.18
0.21%
jan 1, 1996
86.106
+0.178
0.21%
jan 1, 1997
86.283
+0.177
0.21%
jan 1, 1998
86.504
+0.221
0.26%
jan 1, 1999
86.727
+0.223
0.26%
jan 1, 2000
86.947
+0.22
0.25%
jan 1, 2001
87.165
+0.218
0.25%
jan 1, 2002
87.378
+0.213
0.24%
jan 1, 2003
87.541
+0.163
0.19%
jan 1, 2004
87.695
+0.154
0.18%
jan 1, 2005
87.849
+0.154
0.18%
jan 1, 2006
88.0
+0.151
0.17%
jan 1, 2007
88.15
+0.15
0.17%
jan 1, 2008
88.298
+0.148
0.17%
jan 1, 2009
88.445
+0.147
0.17%
jan 1, 2010
88.59
+0.145
0.16%
jan 1, 2011
88.733
+0.143
0.16%
jan 1, 2012
88.875
+0.142
0.16%
jan 1, 2013
89.015
+0.14
0.16%
jan 1, 2014
89.153
+0.138
0.16%
jan 1, 2015
89.289
+0.136
0.15%
jan 1, 2016
89.423
+0.134
0.15%
Ranking of countries by current statistics by years


Comments: