29
/
en
AIzaSyAYiBZKx7MnpbEhh9jyipgxe19OcubqV5w
April 1, 2024
131328
Ethiopia
ETH
true
2
1
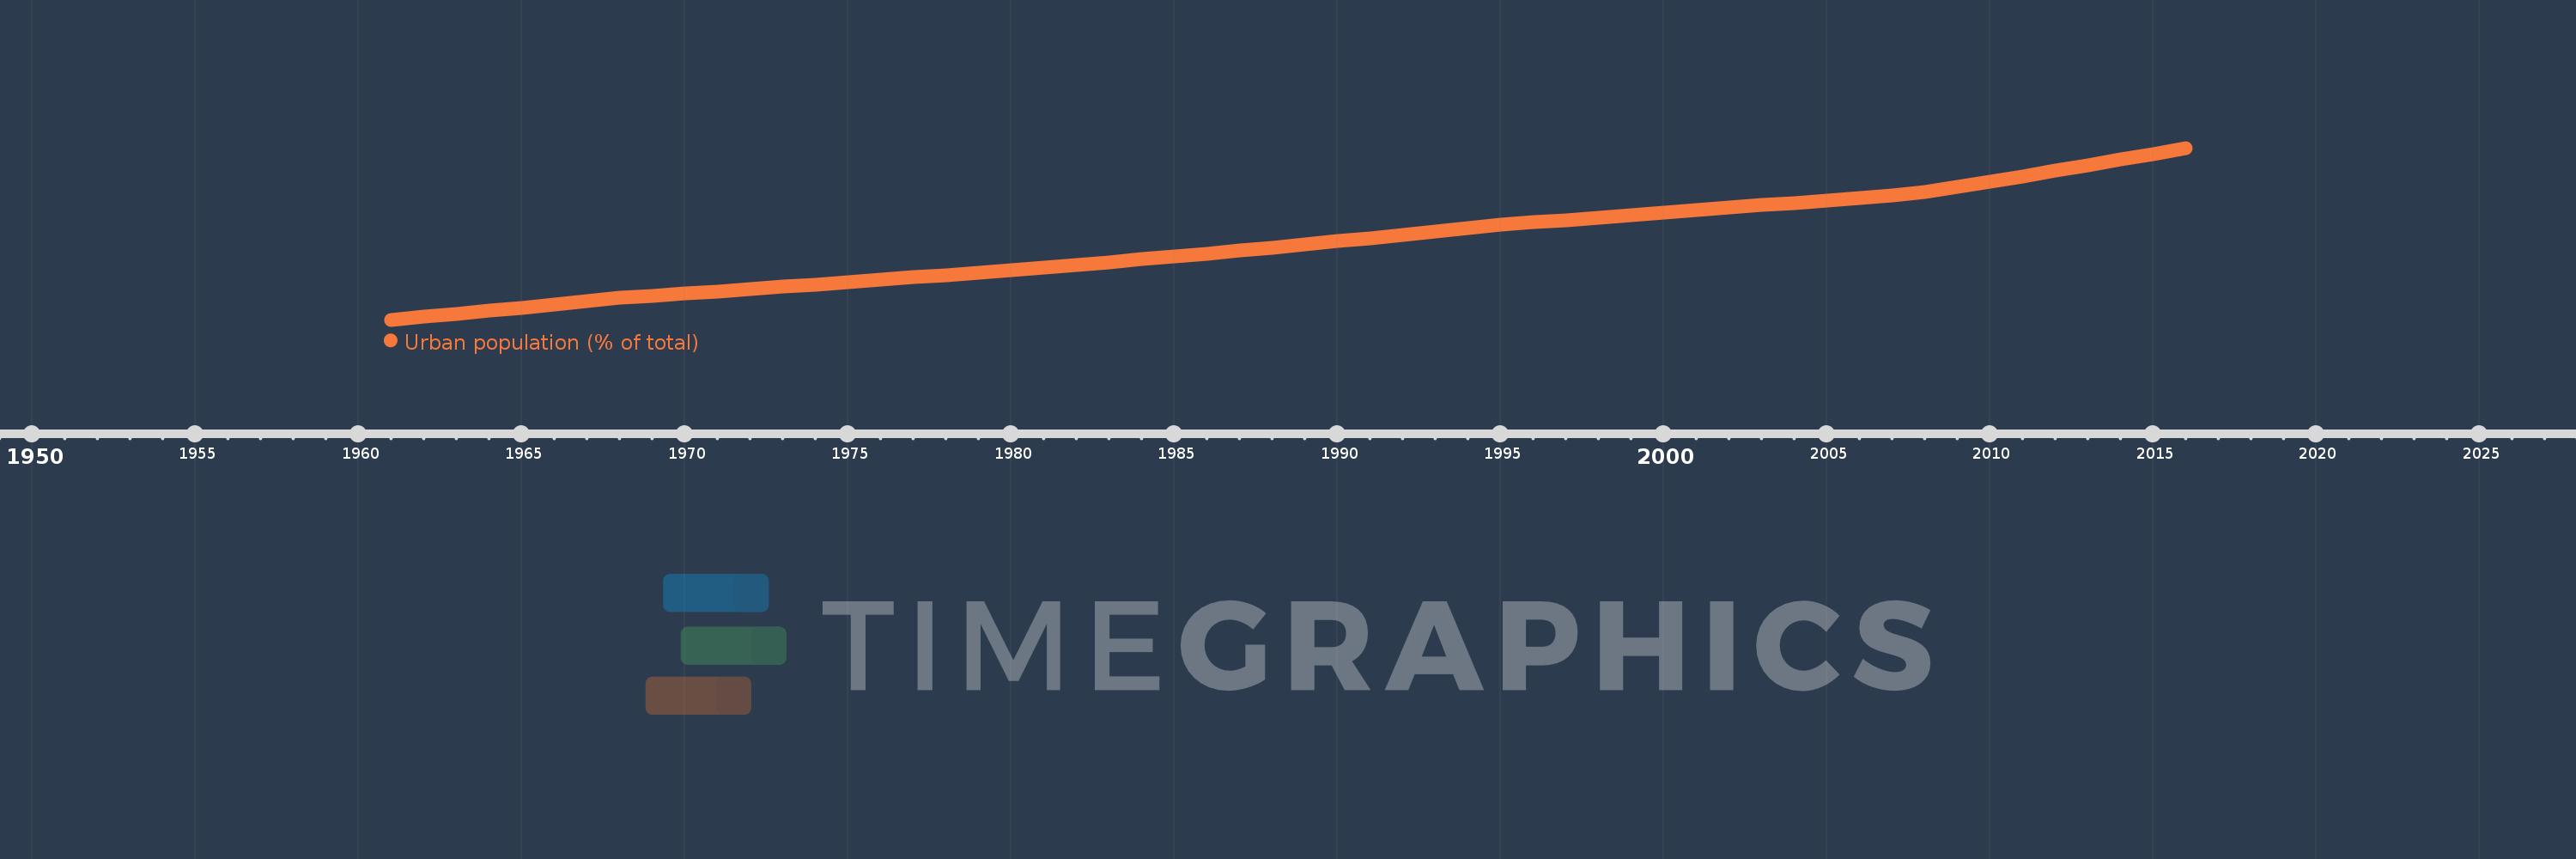
Urban population (% of total)
2016,2015,2014,2013,2012,2011,2010,2009,2008,2007,2006,2005,2004,2003,2002,2001,2000,1999,1998,1997,1996,1995,1994,1993,1992,1991,1990,1989,1988,1987,1986,1985,1984,1983,1982,1981,1980,1979,1978,1977,1976,1975,1974,1973,1972,1971,1970,1969,1968,1967,1966,1965,1964,1963,1962,1961
This statistics in other country:
AfghanistanAlbaniaAlgeriaAmerican SamoaAndorraAngolaAntigua and BarbudaArab WorldArgentinaArmeniaArubaAustraliaAustriaAzerbaijanBahamas, TheBahrainBangladeshBarbadosBelarusBelgiumBelizeBeninBermudaBhutanBoliviaBosnia and HerzegovinaBotswanaBrazilBritish Virgin IslandsBrunei DarussalamBulgariaBurkina FasoBurundiCabo VerdeCambodiaCameroonCanadaCaribbean small statesCayman IslandsCentral African RepublicCentral Europe and the BalticsChadChannel IslandsChileChinaColombiaComorosCongo, Dem. Rep.Congo, Rep.Costa RicaCote d'IvoireCroatiaCubaCuracaoCyprusCzech RepublicDenmarkDjiboutiDominicaDominican RepublicEarly-demographic dividendEast Asia & PacificEast Asia & Pacific (excluding high income)East Asia & Pacific (IDA & IBRD countries)EcuadorEgypt, Arab Rep.El SalvadorEquatorial GuineaEritreaEstoniaEthiopiaEuro areaEurope & Central AsiaEurope & Central Asia (excluding high income)Europe & Central Asia (IDA & IBRD countries)European UnionFaroe IslandsFijiFinlandFragile and conflict affected situationsFranceFrench PolynesiaGabonGambia, TheGeorgiaGermanyGhanaGibraltarGreeceGreenlandGrenadaGuamGuatemalaGuineaGuinea-BissauGuyanaHaitiHeavily indebted poor countries (HIPC)High incomeHondurasHong Kong SAR, ChinaHungaryIBRD onlyIcelandIDA & IBRD totalIDA blendIDA onlyIDA totalIndiaIndonesiaIran, Islamic Rep.IraqIrelandIsle of ManIsraelItalyJamaicaJapanJordanKazakhstanKenyaKiribatiKorea, Dem. People’s Rep.Korea, Rep.KuwaitKyrgyz RepublicLao PDRLate-demographic dividendLatin America & Caribbean Latin America & Caribbean (excluding high income)Latin America & the Caribbean (IDA & IBRD countries)LatviaLeast developed countries: UN classificationLebanonLesothoLiberiaLibyaLiechtensteinLithuaniaLow & middle incomeLow incomeLower middle incomeLuxembourgMacao SAR, ChinaMacedonia, FYRMadagascarMalawiMalaysiaMaldivesMaliMaltaMarshall IslandsMauritaniaMauritiusMexicoMicronesia, Fed. Sts.Middle East & North AfricaMiddle East & North Africa (excluding high income)Middle East & North Africa (IDA & IBRD countries)Middle incomeMoldovaMonacoMongoliaMontenegroMoroccoMozambiqueMyanmarNamibiaNauruNepalNetherlandsNew CaledoniaNew ZealandNicaraguaNigerNigeriaNorth AmericaNorthern Mariana IslandsNorwayOECD membersOmanOther small statesPacific island small statesPakistanPalauPanamaPapua New GuineaParaguayPeruPhilippinesPolandPortugalPost-demographic dividendPre-demographic dividendPuerto RicoQatarRomaniaRussian FederationRwandaSamoaSan MarinoSao Tome and PrincipeSaudi ArabiaSenegalSerbiaSeychellesSierra LeoneSingaporeSint Maarten (Dutch part)Slovak RepublicSloveniaSmall statesSolomon IslandsSomaliaSouth AfricaSouth AsiaSouth Asia (IDA & IBRD)South SudanSpainSri LankaSt. Kitts and NevisSt. LuciaSt. Vincent and the GrenadinesSub-Saharan Africa Sub-Saharan Africa (excluding high income)Sub-Saharan Africa (IDA & IBRD countries)SudanSurinameSwazilandSwedenSwitzerlandSyrian Arab RepublicTajikistanTanzaniaThailandTimor-LesteTogoTongaTrinidad and TobagoTunisiaTurkeyTurkmenistanTurks and Caicos IslandsTuvaluUgandaUkraineUnited Arab EmiratesUnited KingdomUnited StatesUpper middle incomeUruguayUzbekistanVanuatuVenezuela, RBVietnamVirgin Islands (U.S.)West Bank and GazaWorldYemen, Rep.ZambiaZimbabwe Timeline:
This timeline shows a graph from 1961 to 2016 of Ethiopia. No data until 1960. Number of actual observations by date: 56.
Source name:
World Development Indicators
Source organization:
United Nations, World Urbanization Prospects.
Categories, topics:
Climate Change, Urban Development
Last updated:
apr 23, 2017
Indicators value changes by year
Maximum:
19.472
jan 1, 2016
At the date of observation
Value
Absolute change
Change from previous value
jan 1, 1961
6.433
+6.433
0.0%
jan 1, 1962
6.65
+0.217
3.37%
jan 1, 1963
6.874
+0.224
3.37%
jan 1, 1964
7.104
+0.23
3.35%
jan 1, 1965
7.342
+0.238
3.35%
jan 1, 1966
7.587
+0.245
3.34%
jan 1, 1967
7.84
+0.253
3.33%
jan 1, 1968
8.1
+0.26
3.32%
jan 1, 1969
8.26
+0.16
1.98%
jan 1, 1970
8.422
+0.162
1.96%
jan 1, 1971
8.588
+0.166
1.97%
jan 1, 1972
8.756
+0.168
1.96%
jan 1, 1973
8.928
+0.172
1.96%
jan 1, 1974
9.102
+0.174
1.95%
jan 1, 1975
9.279
+0.177
1.94%
jan 1, 1976
9.46
+0.181
1.95%
jan 1, 1977
9.644
+0.184
1.95%
jan 1, 1978
9.83
+0.186
1.93%
jan 1, 1979
10.02
+0.19
1.93%
jan 1, 1980
10.214
+0.194
1.94%
jan 1, 1981
10.41
+0.196
1.92%
jan 1, 1982
10.61
+0.2
1.92%
jan 1, 1983
10.813
+0.203
1.91%
jan 1, 1984
11.02
+0.207
1.91%
jan 1, 1985
11.232
+0.212
1.92%
jan 1, 1986
11.453
+0.221
1.97%
jan 1, 1987
11.679
+0.226
1.97%
jan 1, 1988
11.909
+0.23
1.97%
jan 1, 1989
12.143
+0.234
1.96%
jan 1, 1990
12.38
+0.237
1.95%
jan 1, 1991
12.621
+0.241
1.95%
jan 1, 1992
12.867
+0.246
1.95%
jan 1, 1993
13.116
+0.249
1.94%
jan 1, 1994
13.37
+0.254
1.94%
jan 1, 1995
13.627
+0.257
1.92%
jan 1, 1996
13.827
+0.2
1.47%
jan 1, 1997
14.006
+0.179
1.29%
jan 1, 1998
14.186
+0.18
1.29%
jan 1, 1999
14.369
+0.183
1.29%
jan 1, 2000
14.553
+0.184
1.28%
jan 1, 2001
14.74
+0.187
1.28%
jan 1, 2002
14.927
+0.187
1.27%
jan 1, 2003
15.118
+0.191
1.28%
jan 1, 2004
15.31
+0.192
1.27%
jan 1, 2005
15.504
+0.194
1.27%
jan 1, 2006
15.7
+0.196
1.26%
jan 1, 2007
15.899
+0.199
1.27%
jan 1, 2008
16.116
+0.217
1.36%
jan 1, 2009
16.51
+0.394
2.44%
jan 1, 2010
16.91
+0.4
2.42%
jan 1, 2011
17.319
+0.409
2.42%
jan 1, 2012
17.735
+0.416
2.4%
jan 1, 2013
18.16
+0.425
2.4%
jan 1, 2014
18.59
+0.43
2.37%
jan 1, 2015
19.028
+0.438
2.36%
jan 1, 2016
19.472
+0.444
2.33%
Ranking of countries by current statistics by years


Comments: