29
/
en
AIzaSyAYiBZKx7MnpbEhh9jyipgxe19OcubqV5w
April 1, 2024
55978
Pre-demographic dividend
PRE
false
2
1
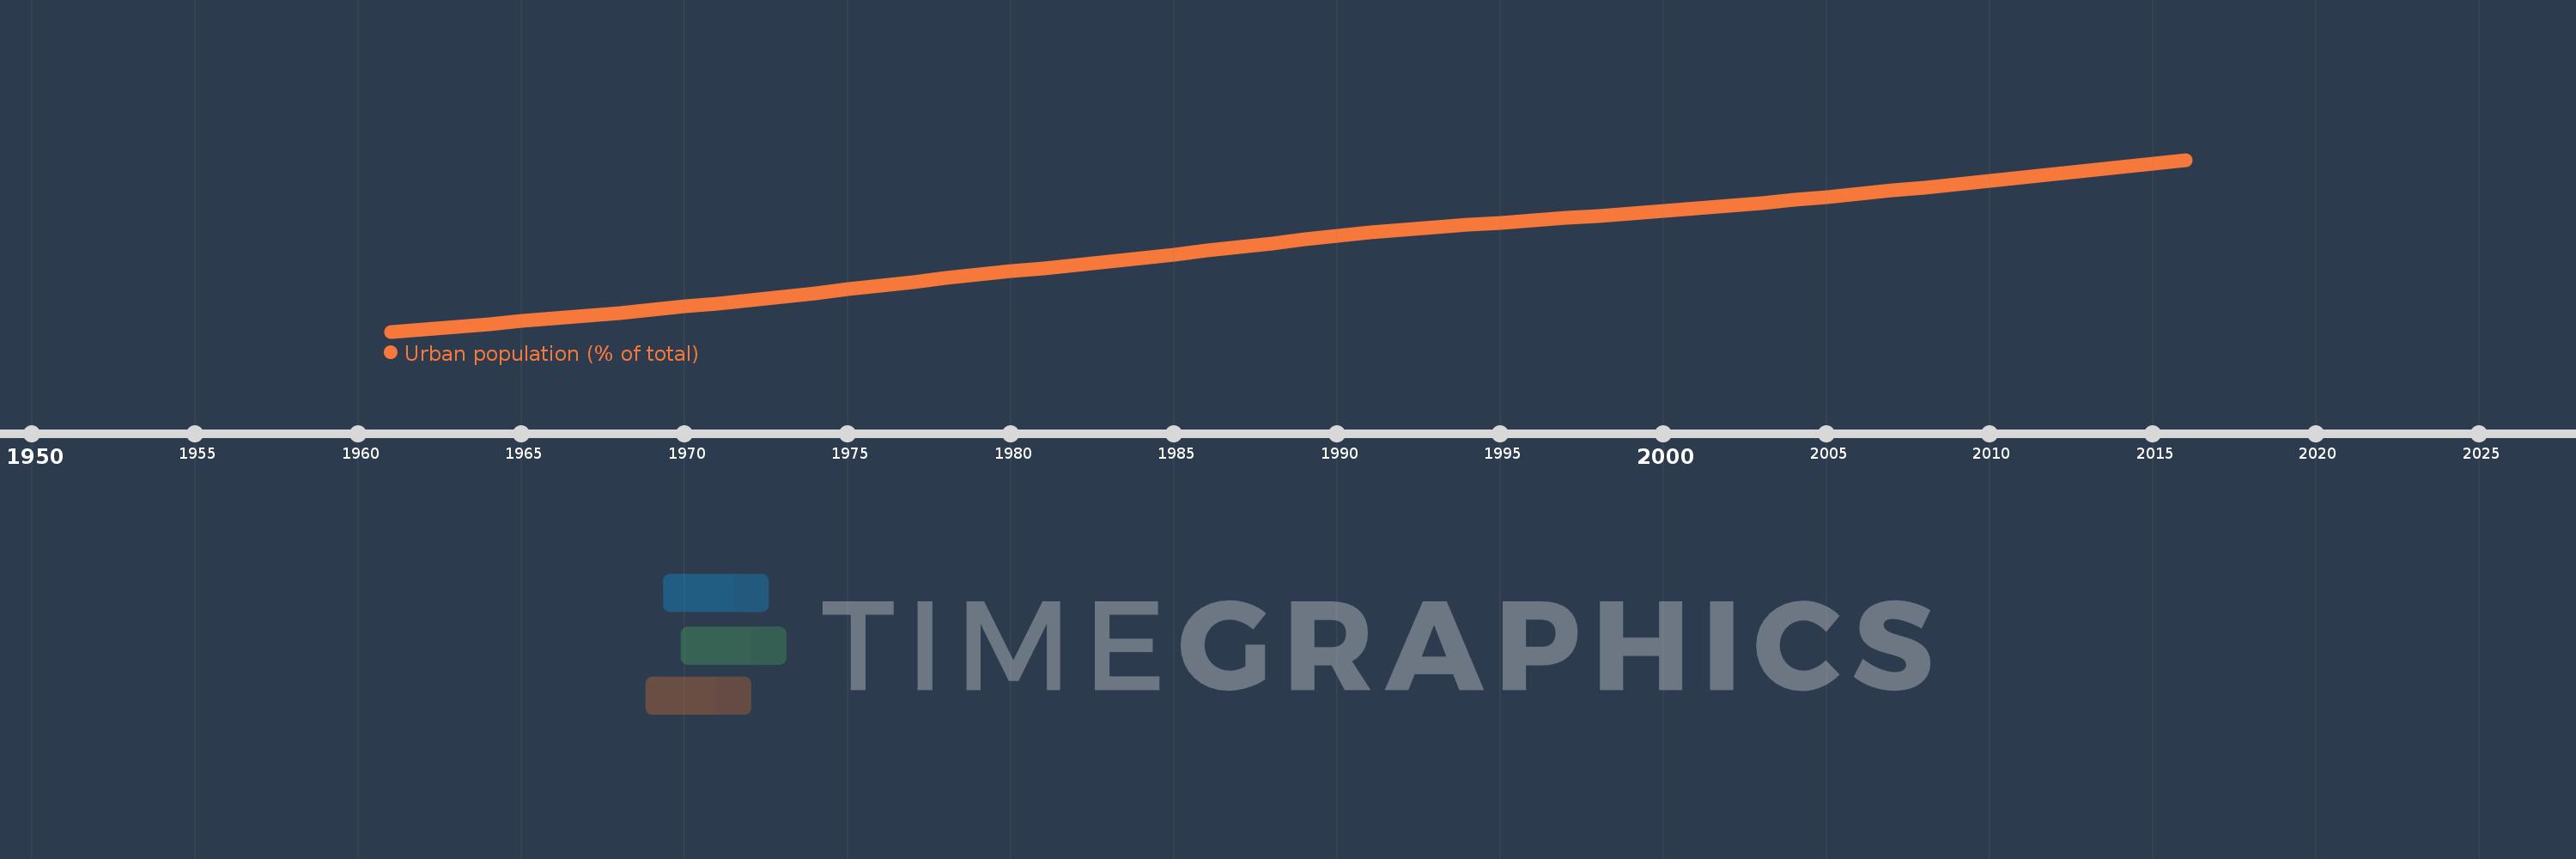
Urban population (% of total)
2016,2015,2014,2013,2012,2011,2010,2009,2008,2007,2006,2005,2004,2003,2002,2001,2000,1999,1998,1997,1996,1995,1994,1993,1992,1991,1990,1989,1988,1987,1986,1985,1984,1983,1982,1981,1980,1979,1978,1977,1976,1975,1974,1973,1972,1971,1970,1969,1968,1967,1966,1965,1964,1963,1962,1961
This statistics in other country:
AfghanistanAlbaniaAlgeriaAmerican SamoaAndorraAngolaAntigua and BarbudaArab WorldArgentinaArmeniaArubaAustraliaAustriaAzerbaijanBahamas, TheBahrainBangladeshBarbadosBelarusBelgiumBelizeBeninBermudaBhutanBoliviaBosnia and HerzegovinaBotswanaBrazilBritish Virgin IslandsBrunei DarussalamBulgariaBurkina FasoBurundiCabo VerdeCambodiaCameroonCanadaCaribbean small statesCayman IslandsCentral African RepublicCentral Europe and the BalticsChadChannel IslandsChileChinaColombiaComorosCongo, Dem. Rep.Congo, Rep.Costa RicaCote d'IvoireCroatiaCubaCuracaoCyprusCzech RepublicDenmarkDjiboutiDominicaDominican RepublicEarly-demographic dividendEast Asia & PacificEast Asia & Pacific (excluding high income)East Asia & Pacific (IDA & IBRD countries)EcuadorEgypt, Arab Rep.El SalvadorEquatorial GuineaEritreaEstoniaEthiopiaEuro areaEurope & Central AsiaEurope & Central Asia (excluding high income)Europe & Central Asia (IDA & IBRD countries)European UnionFaroe IslandsFijiFinlandFragile and conflict affected situationsFranceFrench PolynesiaGabonGambia, TheGeorgiaGermanyGhanaGibraltarGreeceGreenlandGrenadaGuamGuatemalaGuineaGuinea-BissauGuyanaHaitiHeavily indebted poor countries (HIPC)High incomeHondurasHong Kong SAR, ChinaHungaryIBRD onlyIcelandIDA & IBRD totalIDA blendIDA onlyIDA totalIndiaIndonesiaIran, Islamic Rep.IraqIrelandIsle of ManIsraelItalyJamaicaJapanJordanKazakhstanKenyaKiribatiKorea, Dem. People’s Rep.Korea, Rep.KuwaitKyrgyz RepublicLao PDRLate-demographic dividendLatin America & Caribbean Latin America & Caribbean (excluding high income)Latin America & the Caribbean (IDA & IBRD countries)LatviaLeast developed countries: UN classificationLebanonLesothoLiberiaLibyaLiechtensteinLithuaniaLow & middle incomeLow incomeLower middle incomeLuxembourgMacao SAR, ChinaMacedonia, FYRMadagascarMalawiMalaysiaMaldivesMaliMaltaMarshall IslandsMauritaniaMauritiusMexicoMicronesia, Fed. Sts.Middle East & North AfricaMiddle East & North Africa (excluding high income)Middle East & North Africa (IDA & IBRD countries)Middle incomeMoldovaMonacoMongoliaMontenegroMoroccoMozambiqueMyanmarNamibiaNauruNepalNetherlandsNew CaledoniaNew ZealandNicaraguaNigerNigeriaNorth AmericaNorthern Mariana IslandsNorwayOECD membersOmanOther small statesPacific island small statesPakistanPalauPanamaPapua New GuineaParaguayPeruPhilippinesPolandPortugalPost-demographic dividendPre-demographic dividendPuerto RicoQatarRomaniaRussian FederationRwandaSamoaSan MarinoSao Tome and PrincipeSaudi ArabiaSenegalSerbiaSeychellesSierra LeoneSingaporeSint Maarten (Dutch part)Slovak RepublicSloveniaSmall statesSolomon IslandsSomaliaSouth AfricaSouth AsiaSouth Asia (IDA & IBRD)South SudanSpainSri LankaSt. Kitts and NevisSt. LuciaSt. Vincent and the GrenadinesSub-Saharan Africa Sub-Saharan Africa (excluding high income)Sub-Saharan Africa (IDA & IBRD countries)SudanSurinameSwazilandSwedenSwitzerlandSyrian Arab RepublicTajikistanTanzaniaThailandTimor-LesteTogoTongaTrinidad and TobagoTunisiaTurkeyTurkmenistanTurks and Caicos IslandsTuvaluUgandaUkraineUnited Arab EmiratesUnited KingdomUnited StatesUpper middle incomeUruguayUzbekistanVanuatuVenezuela, RBVietnamVirgin Islands (U.S.)West Bank and GazaWorldYemen, Rep.ZambiaZimbabwe Timeline:
This timeline shows a graph from 1961 to 2016 of Pre-demographic dividend. No data until 1960. Number of actual observations by date: 56.
Source name:
World Development Indicators
Source organization:
United Nations, World Urbanization Prospects.
Categories, topics:
Climate Change, Urban Development
Last updated:
apr 23, 2017
Indicators value changes by year
Minimum:
13.354
jan 1, 1961
Maximum:
38.595
jan 1, 2016
At the date of observation
Value
Absolute change
Change from previous value
jan 1, 1961
13.354
+13.354
0.0%
jan 1, 1962
13.711
+0.357
2.67%
jan 1, 1963
14.08
+0.369
2.69%
jan 1, 1964
14.467
+0.387
2.75%
jan 1, 1965
14.874
+0.407
2.82%
jan 1, 1966
15.296
+0.422
2.84%
jan 1, 1967
15.703
+0.407
2.66%
jan 1, 1968
16.119
+0.416
2.65%
jan 1, 1969
16.562
+0.442
2.74%
jan 1, 1970
17.018
+0.457
2.76%
jan 1, 1971
17.471
+0.453
2.66%
jan 1, 1972
17.978
+0.507
2.9%
jan 1, 1973
18.501
+0.523
2.91%
jan 1, 1974
19.031
+0.53
2.86%
jan 1, 1975
19.558
+0.527
2.77%
jan 1, 1976
20.098
+0.54
2.76%
jan 1, 1977
20.653
+0.555
2.76%
jan 1, 1978
21.197
+0.544
2.63%
jan 1, 1979
21.736
+0.539
2.54%
jan 1, 1980
22.206
+0.47
2.16%
jan 1, 1981
22.643
+0.437
1.97%
jan 1, 1982
23.127
+0.484
2.14%
jan 1, 1983
23.62
+0.492
2.13%
jan 1, 1984
24.133
+0.513
2.17%
jan 1, 1985
24.678
+0.545
2.26%
jan 1, 1986
25.243
+0.564
2.29%
jan 1, 1987
25.801
+0.559
2.21%
jan 1, 1988
26.353
+0.552
2.14%
jan 1, 1989
26.877
+0.525
1.99%
jan 1, 1990
27.382
+0.505
1.88%
jan 1, 1991
27.906
+0.524
1.91%
jan 1, 1992
28.316
+0.41
1.47%
jan 1, 1993
28.697
+0.381
1.35%
jan 1, 1994
29.069
+0.372
1.3%
jan 1, 1995
29.382
+0.313
1.08%
jan 1, 1996
29.699
+0.317
1.08%
jan 1, 1997
30.02
+0.321
1.08%
jan 1, 1998
30.363
+0.342
1.14%
jan 1, 1999
30.707
+0.345
1.13%
jan 1, 2000
31.055
+0.348
1.13%
jan 1, 2001
31.403
+0.347
1.12%
jan 1, 2002
31.821
+0.418
1.33%
jan 1, 2003
32.242
+0.422
1.32%
jan 1, 2004
32.682
+0.44
1.36%
jan 1, 2005
33.13
+0.448
1.37%
jan 1, 2006
33.593
+0.463
1.4%
jan 1, 2007
34.064
+0.471
1.4%
jan 1, 2008
34.544
+0.48
1.41%
jan 1, 2009
35.032
+0.488
1.41%
jan 1, 2010
35.526
+0.494
1.41%
jan 1, 2011
36.029
+0.503
1.41%
jan 1, 2012
36.536
+0.507
1.41%
jan 1, 2013
37.048
+0.512
1.4%
jan 1, 2014
37.562
+0.515
1.39%
jan 1, 2015
38.078
+0.516
1.37%
jan 1, 2016
38.595
+0.517
1.36%
Ranking of countries by current statistics by years


Comments: