29
/
en
AIzaSyAYiBZKx7MnpbEhh9jyipgxe19OcubqV5w
April 1, 2024
135119
French Polynesia
PYF
true
2
1
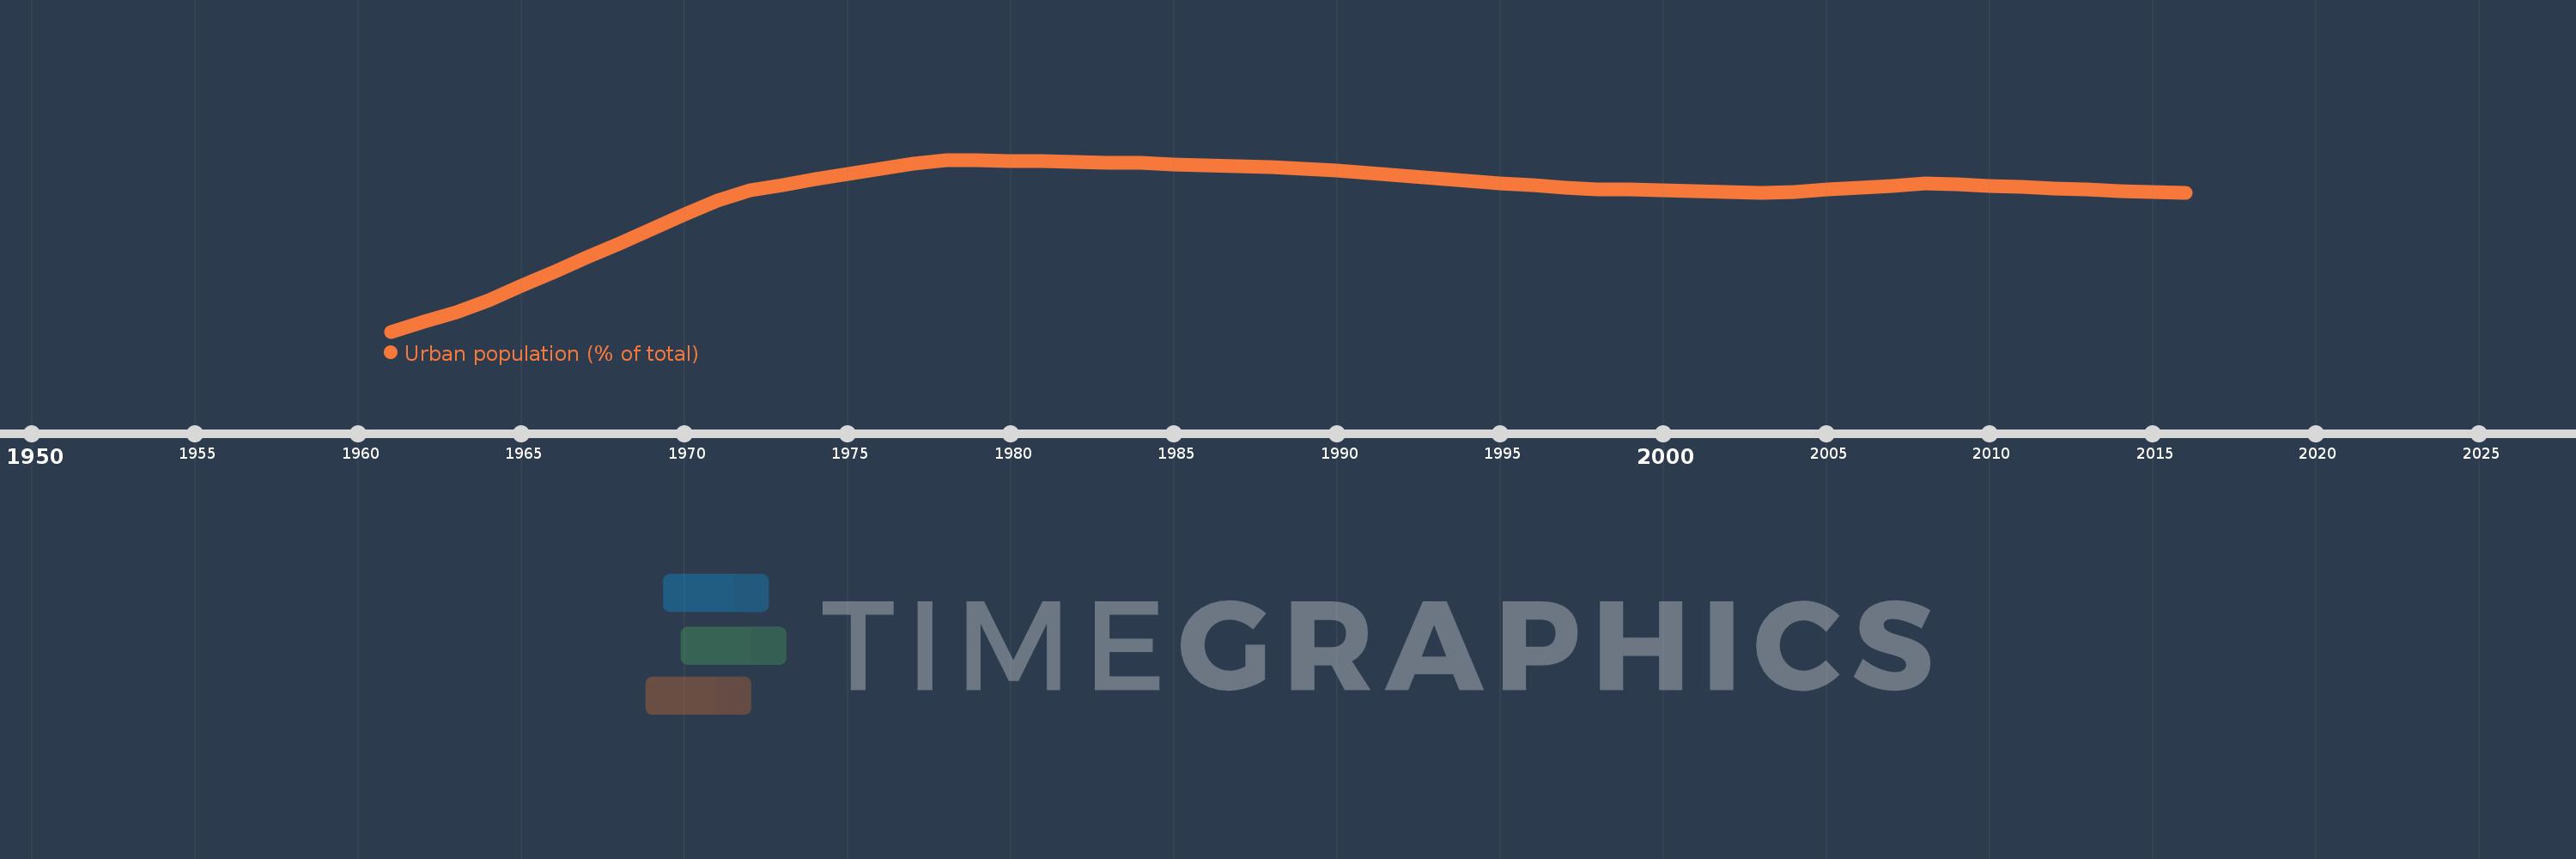
Urban population (% of total)
2016,2015,2014,2013,2012,2011,2010,2009,2008,2007,2006,2005,2004,2003,2002,2001,2000,1999,1998,1997,1996,1995,1994,1993,1992,1991,1990,1989,1988,1987,1986,1985,1984,1983,1982,1981,1980,1979,1978,1977,1976,1975,1974,1973,1972,1971,1970,1969,1968,1967,1966,1965,1964,1963,1962,1961
This statistics in other country:
AfghanistanAlbaniaAlgeriaAmerican SamoaAndorraAngolaAntigua and BarbudaArab WorldArgentinaArmeniaArubaAustraliaAustriaAzerbaijanBahamas, TheBahrainBangladeshBarbadosBelarusBelgiumBelizeBeninBermudaBhutanBoliviaBosnia and HerzegovinaBotswanaBrazilBritish Virgin IslandsBrunei DarussalamBulgariaBurkina FasoBurundiCabo VerdeCambodiaCameroonCanadaCaribbean small statesCayman IslandsCentral African RepublicCentral Europe and the BalticsChadChannel IslandsChileChinaColombiaComorosCongo, Dem. Rep.Congo, Rep.Costa RicaCote d'IvoireCroatiaCubaCuracaoCyprusCzech RepublicDenmarkDjiboutiDominicaDominican RepublicEarly-demographic dividendEast Asia & PacificEast Asia & Pacific (excluding high income)East Asia & Pacific (IDA & IBRD countries)EcuadorEgypt, Arab Rep.El SalvadorEquatorial GuineaEritreaEstoniaEthiopiaEuro areaEurope & Central AsiaEurope & Central Asia (excluding high income)Europe & Central Asia (IDA & IBRD countries)European UnionFaroe IslandsFijiFinlandFragile and conflict affected situationsFranceFrench PolynesiaGabonGambia, TheGeorgiaGermanyGhanaGibraltarGreeceGreenlandGrenadaGuamGuatemalaGuineaGuinea-BissauGuyanaHaitiHeavily indebted poor countries (HIPC)High incomeHondurasHong Kong SAR, ChinaHungaryIBRD onlyIcelandIDA & IBRD totalIDA blendIDA onlyIDA totalIndiaIndonesiaIran, Islamic Rep.IraqIrelandIsle of ManIsraelItalyJamaicaJapanJordanKazakhstanKenyaKiribatiKorea, Dem. People’s Rep.Korea, Rep.KuwaitKyrgyz RepublicLao PDRLate-demographic dividendLatin America & Caribbean Latin America & Caribbean (excluding high income)Latin America & the Caribbean (IDA & IBRD countries)LatviaLeast developed countries: UN classificationLebanonLesothoLiberiaLibyaLiechtensteinLithuaniaLow & middle incomeLow incomeLower middle incomeLuxembourgMacao SAR, ChinaMacedonia, FYRMadagascarMalawiMalaysiaMaldivesMaliMaltaMarshall IslandsMauritaniaMauritiusMexicoMicronesia, Fed. Sts.Middle East & North AfricaMiddle East & North Africa (excluding high income)Middle East & North Africa (IDA & IBRD countries)Middle incomeMoldovaMonacoMongoliaMontenegroMoroccoMozambiqueMyanmarNamibiaNauruNepalNetherlandsNew CaledoniaNew ZealandNicaraguaNigerNigeriaNorth AmericaNorthern Mariana IslandsNorwayOECD membersOmanOther small statesPacific island small statesPakistanPalauPanamaPapua New GuineaParaguayPeruPhilippinesPolandPortugalPost-demographic dividendPre-demographic dividendPuerto RicoQatarRomaniaRussian FederationRwandaSamoaSan MarinoSao Tome and PrincipeSaudi ArabiaSenegalSerbiaSeychellesSierra LeoneSingaporeSint Maarten (Dutch part)Slovak RepublicSloveniaSmall statesSolomon IslandsSomaliaSouth AfricaSouth AsiaSouth Asia (IDA & IBRD)South SudanSpainSri LankaSt. Kitts and NevisSt. LuciaSt. Vincent and the GrenadinesSub-Saharan Africa Sub-Saharan Africa (excluding high income)Sub-Saharan Africa (IDA & IBRD countries)SudanSurinameSwazilandSwedenSwitzerlandSyrian Arab RepublicTajikistanTanzaniaThailandTimor-LesteTogoTongaTrinidad and TobagoTunisiaTurkeyTurkmenistanTurks and Caicos IslandsTuvaluUgandaUkraineUnited Arab EmiratesUnited KingdomUnited StatesUpper middle incomeUruguayUzbekistanVanuatuVenezuela, RBVietnamVirgin Islands (U.S.)West Bank and GazaWorldYemen, Rep.ZambiaZimbabwe Timeline:
This timeline shows a graph from 1961 to 2016 of French Polynesia. No data until 1960. Number of actual observations by date: 56.
Source name:
World Development Indicators
Source organization:
United Nations, World Urbanization Prospects.
Categories, topics:
Climate Change, Urban Development
Last updated:
apr 23, 2017
Indicators value changes by year
Minimum:
42.281
jan 1, 1961
Maximum:
59.171
jan 1, 1978
At the date of observation
Value
Absolute change
Change from previous value
jan 1, 1961
42.281
+42.281
0.0%
jan 1, 1962
43.217
+0.936
2.21%
jan 1, 1963
44.16
+0.943
2.18%
jan 1, 1964
45.389
+1.229
2.78%
jan 1, 1965
46.783
+1.394
3.07%
jan 1, 1966
48.178
+1.395
2.98%
jan 1, 1967
49.578
+1.4
2.91%
jan 1, 1968
50.979
+1.401
2.83%
jan 1, 1969
52.38
+1.401
2.75%
jan 1, 1970
53.773
+1.393
2.66%
jan 1, 1971
55.162
+1.389
2.58%
jan 1, 1972
56.203
+1.041
1.89%
jan 1, 1973
56.718
+0.515
0.92%
jan 1, 1974
57.231
+0.513
0.9%
jan 1, 1975
57.742
+0.511
0.89%
jan 1, 1976
58.252
+0.51
0.88%
jan 1, 1977
58.76
+0.508
0.87%
jan 1, 1978
59.171
+0.411
0.7%
jan 1, 1979
59.115
-0.056
-0.09%
jan 1, 1980
59.059
-0.056
-0.09%
jan 1, 1981
59.003
-0.056
-0.09%
jan 1, 1982
58.948
-0.055
-0.09%
jan 1, 1983
58.892
-0.056
-0.09%
jan 1, 1984
58.836
-0.056
-0.1%
jan 1, 1985
58.745
-0.091
-0.15%
jan 1, 1986
58.639
-0.106
-0.18%
jan 1, 1987
58.532
-0.107
-0.18%
jan 1, 1988
58.426
-0.106
-0.18%
jan 1, 1989
58.32
-0.106
-0.18%
jan 1, 1990
58.103
-0.217
-0.37%
jan 1, 1991
57.86
-0.243
-0.42%
jan 1, 1992
57.616
-0.244
-0.42%
jan 1, 1993
57.372
-0.244
-0.42%
jan 1, 1994
57.128
-0.244
-0.43%
jan 1, 1995
56.883
-0.245
-0.43%
jan 1, 1996
56.638
-0.245
-0.43%
jan 1, 1997
56.393
-0.245
-0.43%
jan 1, 1998
56.29
-0.103
-0.18%
jan 1, 1999
56.217
-0.073
-0.13%
jan 1, 2000
56.144
-0.073
-0.13%
jan 1, 2001
56.071
-0.073
-0.13%
jan 1, 2002
55.999
-0.072
-0.13%
jan 1, 2003
55.926
-0.073
-0.13%
jan 1, 2004
56.029
+0.103
0.18%
jan 1, 2005
56.228
+0.199
0.36%
jan 1, 2006
56.426
+0.198
0.35%
jan 1, 2007
56.625
+0.199
0.35%
jan 1, 2008
56.823
+0.198
0.35%
jan 1, 2009
56.738
-0.085
-0.15%
jan 1, 2010
56.608
-0.13
-0.23%
jan 1, 2011
56.479
-0.129
-0.23%
jan 1, 2012
56.349
-0.13
-0.23%
jan 1, 2013
56.218
-0.131
-0.23%
jan 1, 2014
56.089
-0.129
-0.23%
jan 1, 2015
55.976
-0.113
-0.2%
jan 1, 2016
55.88
-0.096
-0.17%
Ranking of countries by current statistics by years


Comments: