29
/
en
AIzaSyAYiBZKx7MnpbEhh9jyipgxe19OcubqV5w
April 1, 2024
95685
Burkina Faso
BFA
true
2
1
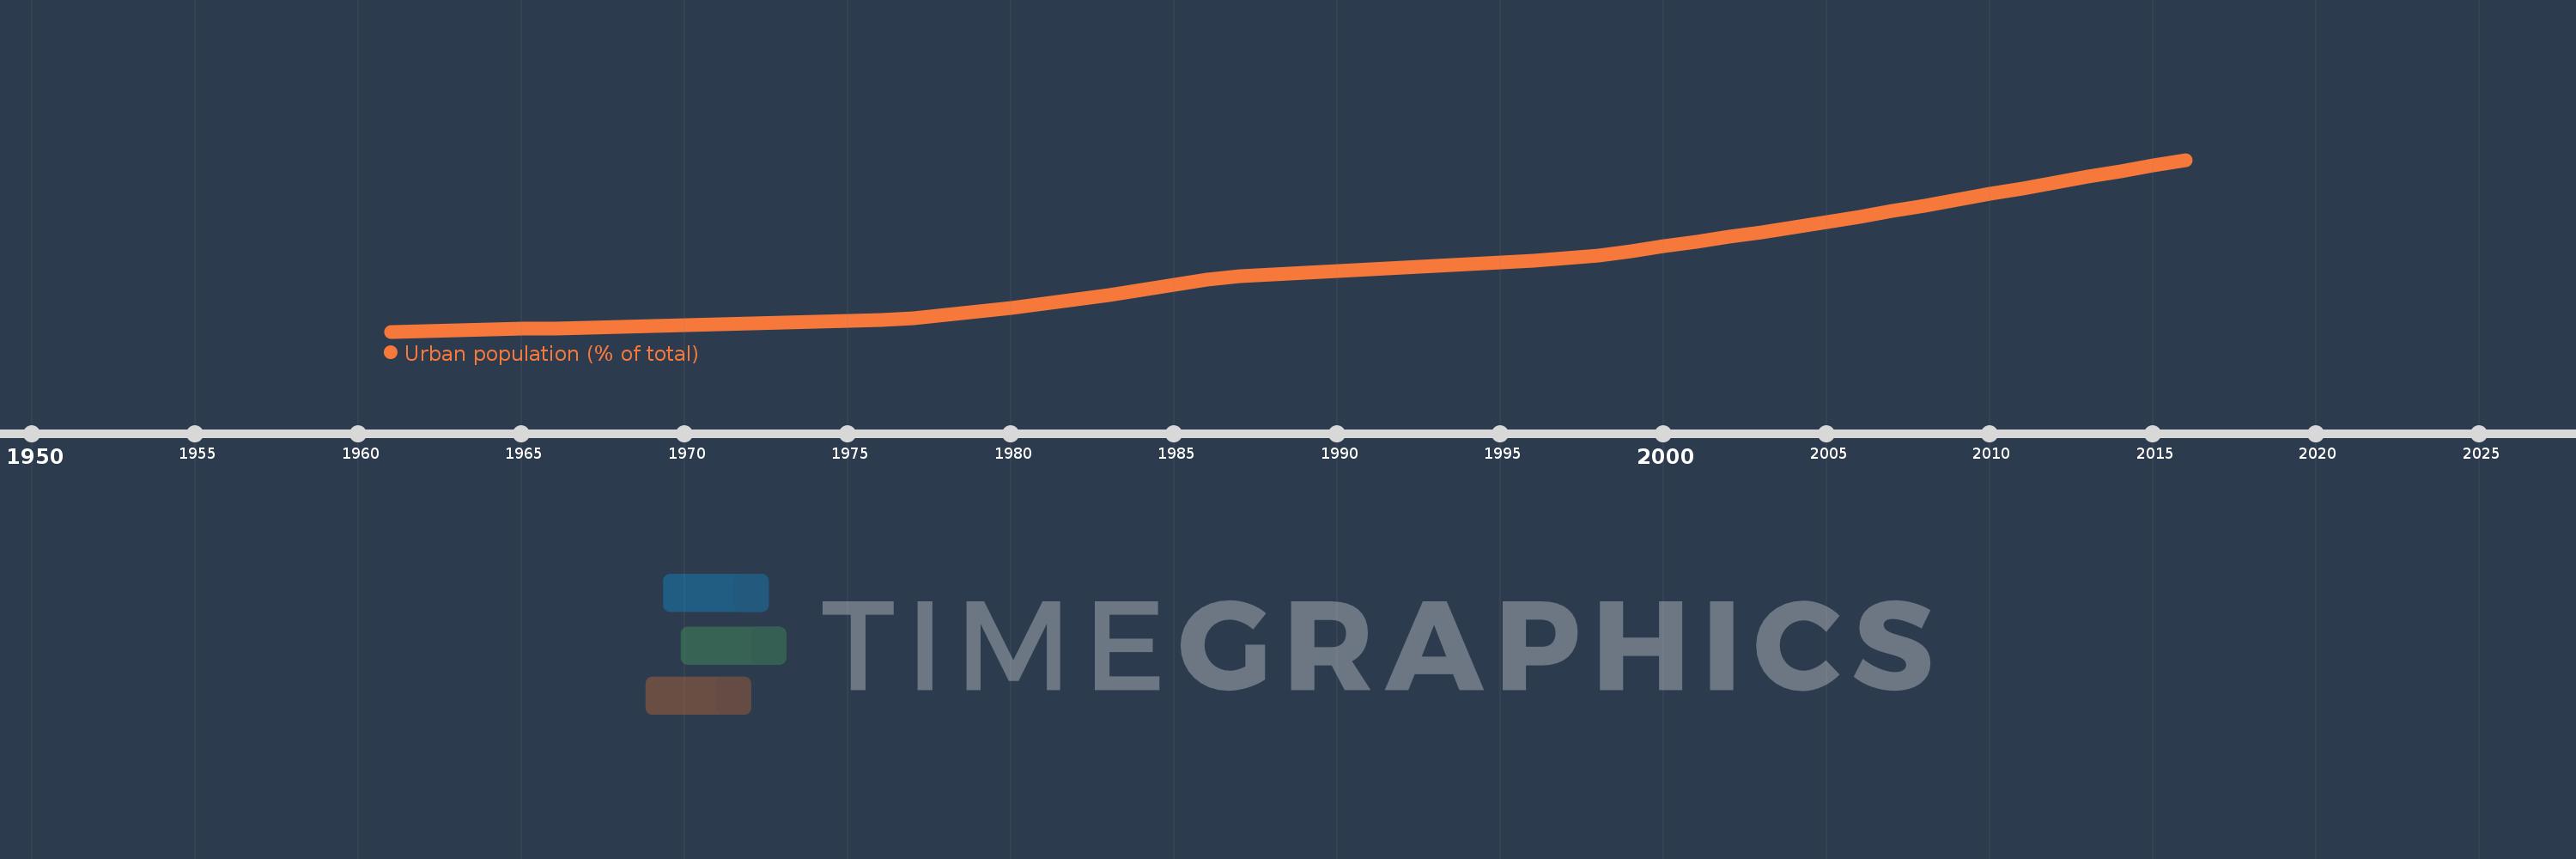
Urban population (% of total)
2016,2015,2014,2013,2012,2011,2010,2009,2008,2007,2006,2005,2004,2003,2002,2001,2000,1999,1998,1997,1996,1995,1994,1993,1992,1991,1990,1989,1988,1987,1986,1985,1984,1983,1982,1981,1980,1979,1978,1977,1976,1975,1974,1973,1972,1971,1970,1969,1968,1967,1966,1965,1964,1963,1962,1961
This statistics in other country:
AfghanistanAlbaniaAlgeriaAmerican SamoaAndorraAngolaAntigua and BarbudaArab WorldArgentinaArmeniaArubaAustraliaAustriaAzerbaijanBahamas, TheBahrainBangladeshBarbadosBelarusBelgiumBelizeBeninBermudaBhutanBoliviaBosnia and HerzegovinaBotswanaBrazilBritish Virgin IslandsBrunei DarussalamBulgariaBurkina FasoBurundiCabo VerdeCambodiaCameroonCanadaCaribbean small statesCayman IslandsCentral African RepublicCentral Europe and the BalticsChadChannel IslandsChileChinaColombiaComorosCongo, Dem. Rep.Congo, Rep.Costa RicaCote d'IvoireCroatiaCubaCuracaoCyprusCzech RepublicDenmarkDjiboutiDominicaDominican RepublicEarly-demographic dividendEast Asia & PacificEast Asia & Pacific (excluding high income)East Asia & Pacific (IDA & IBRD countries)EcuadorEgypt, Arab Rep.El SalvadorEquatorial GuineaEritreaEstoniaEthiopiaEuro areaEurope & Central AsiaEurope & Central Asia (excluding high income)Europe & Central Asia (IDA & IBRD countries)European UnionFaroe IslandsFijiFinlandFragile and conflict affected situationsFranceFrench PolynesiaGabonGambia, TheGeorgiaGermanyGhanaGibraltarGreeceGreenlandGrenadaGuamGuatemalaGuineaGuinea-BissauGuyanaHaitiHeavily indebted poor countries (HIPC)High incomeHondurasHong Kong SAR, ChinaHungaryIBRD onlyIcelandIDA & IBRD totalIDA blendIDA onlyIDA totalIndiaIndonesiaIran, Islamic Rep.IraqIrelandIsle of ManIsraelItalyJamaicaJapanJordanKazakhstanKenyaKiribatiKorea, Dem. People’s Rep.Korea, Rep.KuwaitKyrgyz RepublicLao PDRLate-demographic dividendLatin America & Caribbean Latin America & Caribbean (excluding high income)Latin America & the Caribbean (IDA & IBRD countries)LatviaLeast developed countries: UN classificationLebanonLesothoLiberiaLibyaLiechtensteinLithuaniaLow & middle incomeLow incomeLower middle incomeLuxembourgMacao SAR, ChinaMacedonia, FYRMadagascarMalawiMalaysiaMaldivesMaliMaltaMarshall IslandsMauritaniaMauritiusMexicoMicronesia, Fed. Sts.Middle East & North AfricaMiddle East & North Africa (excluding high income)Middle East & North Africa (IDA & IBRD countries)Middle incomeMoldovaMonacoMongoliaMontenegroMoroccoMozambiqueMyanmarNamibiaNauruNepalNetherlandsNew CaledoniaNew ZealandNicaraguaNigerNigeriaNorth AmericaNorthern Mariana IslandsNorwayOECD membersOmanOther small statesPacific island small statesPakistanPalauPanamaPapua New GuineaParaguayPeruPhilippinesPolandPortugalPost-demographic dividendPre-demographic dividendPuerto RicoQatarRomaniaRussian FederationRwandaSamoaSan MarinoSao Tome and PrincipeSaudi ArabiaSenegalSerbiaSeychellesSierra LeoneSingaporeSint Maarten (Dutch part)Slovak RepublicSloveniaSmall statesSolomon IslandsSomaliaSouth AfricaSouth AsiaSouth Asia (IDA & IBRD)South SudanSpainSri LankaSt. Kitts and NevisSt. LuciaSt. Vincent and the GrenadinesSub-Saharan Africa Sub-Saharan Africa (excluding high income)Sub-Saharan Africa (IDA & IBRD countries)SudanSurinameSwazilandSwedenSwitzerlandSyrian Arab RepublicTajikistanTanzaniaThailandTimor-LesteTogoTongaTrinidad and TobagoTunisiaTurkeyTurkmenistanTurks and Caicos IslandsTuvaluUgandaUkraineUnited Arab EmiratesUnited KingdomUnited StatesUpper middle incomeUruguayUzbekistanVanuatuVenezuela, RBVietnamVirgin Islands (U.S.)West Bank and GazaWorldYemen, Rep.ZambiaZimbabwe Timeline:
This timeline shows a graph from 1961 to 2016 of Burkina Faso. No data until 1960. Number of actual observations by date: 56.
Source name:
World Development Indicators
Source organization:
United Nations, World Urbanization Prospects.
Categories, topics:
Climate Change, Urban Development
Last updated:
apr 23, 2017
Indicators value changes by year
Maximum:
29.859
jan 1, 2016
At the date of observation
Value
Absolute change
Change from previous value
jan 1, 1962
4.796
+0.096
2.04%
jan 1, 1963
4.893
+0.097
2.02%
jan 1, 1964
4.993
+0.1
2.04%
jan 1, 1965
5.095
+0.102
2.04%
jan 1, 1966
5.198
+0.103
2.02%
jan 1, 1967
5.303
+0.105
2.02%
jan 1, 1968
5.411
+0.108
2.04%
jan 1, 1969
5.52
+0.109
2.01%
jan 1, 1970
5.632
+0.112
2.03%
jan 1, 1971
5.746
+0.114
2.02%
jan 1, 1972
5.861
+0.115
2.0%
jan 1, 1973
5.98
+0.119
2.03%
jan 1, 1974
6.1
+0.12
2.01%
jan 1, 1975
6.222
+0.122
2.0%
jan 1, 1976
6.347
+0.125
2.01%
jan 1, 1977
6.668
+0.321
5.06%
jan 1, 1978
7.151
+0.483
7.24%
jan 1, 1979
7.668
+0.517
7.23%
jan 1, 1980
8.218
+0.55
7.17%
jan 1, 1981
8.805
+0.587
7.14%
jan 1, 1982
9.428
+0.623
7.08%
jan 1, 1983
10.091
+0.663
7.03%
jan 1, 1984
10.796
+0.705
6.99%
jan 1, 1985
11.544
+0.748
6.93%
jan 1, 1986
12.334
+0.79
6.84%
jan 1, 1987
12.832
+0.498
4.04%
jan 1, 1988
13.072
+0.24
1.87%
jan 1, 1989
13.316
+0.244
1.87%
jan 1, 1990
13.563
+0.247
1.85%
jan 1, 1991
13.815
+0.252
1.86%
jan 1, 1992
14.07
+0.255
1.85%
jan 1, 1993
14.33
+0.26
1.85%
jan 1, 1994
14.593
+0.263
1.84%
jan 1, 1995
14.86
+0.267
1.83%
jan 1, 1996
15.131
+0.271
1.82%
jan 1, 1997
15.407
+0.276
1.82%
jan 1, 1998
15.875
+0.468
3.04%
jan 1, 1999
16.51
+0.635
4.0%
jan 1, 2000
17.166
+0.656
3.97%
jan 1, 2001
17.844
+0.678
3.95%
jan 1, 2002
18.54
+0.696
3.9%
jan 1, 2003
19.258
+0.718
3.87%
jan 1, 2004
19.996
+0.738
3.83%
jan 1, 2005
20.757
+0.761
3.81%
jan 1, 2006
21.537
+0.78
3.76%
jan 1, 2007
22.339
+0.802
3.72%
jan 1, 2008
23.163
+0.824
3.69%
jan 1, 2009
23.993
+0.83
3.58%
jan 1, 2010
24.828
+0.835
3.48%
jan 1, 2011
25.665
+0.837
3.37%
jan 1, 2012
26.505
+0.84
3.27%
jan 1, 2013
27.346
+0.841
3.17%
jan 1, 2014
28.186
+0.84
3.07%
jan 1, 2015
29.024
+0.838
2.97%
jan 1, 2016
29.859
+0.835
2.88%
Ranking of countries by current statistics by years


Comments: