29
/
en
AIzaSyAYiBZKx7MnpbEhh9jyipgxe19OcubqV5w
April 1, 2024
173688
Kyrgyz Republic
KGZ
true
2
1
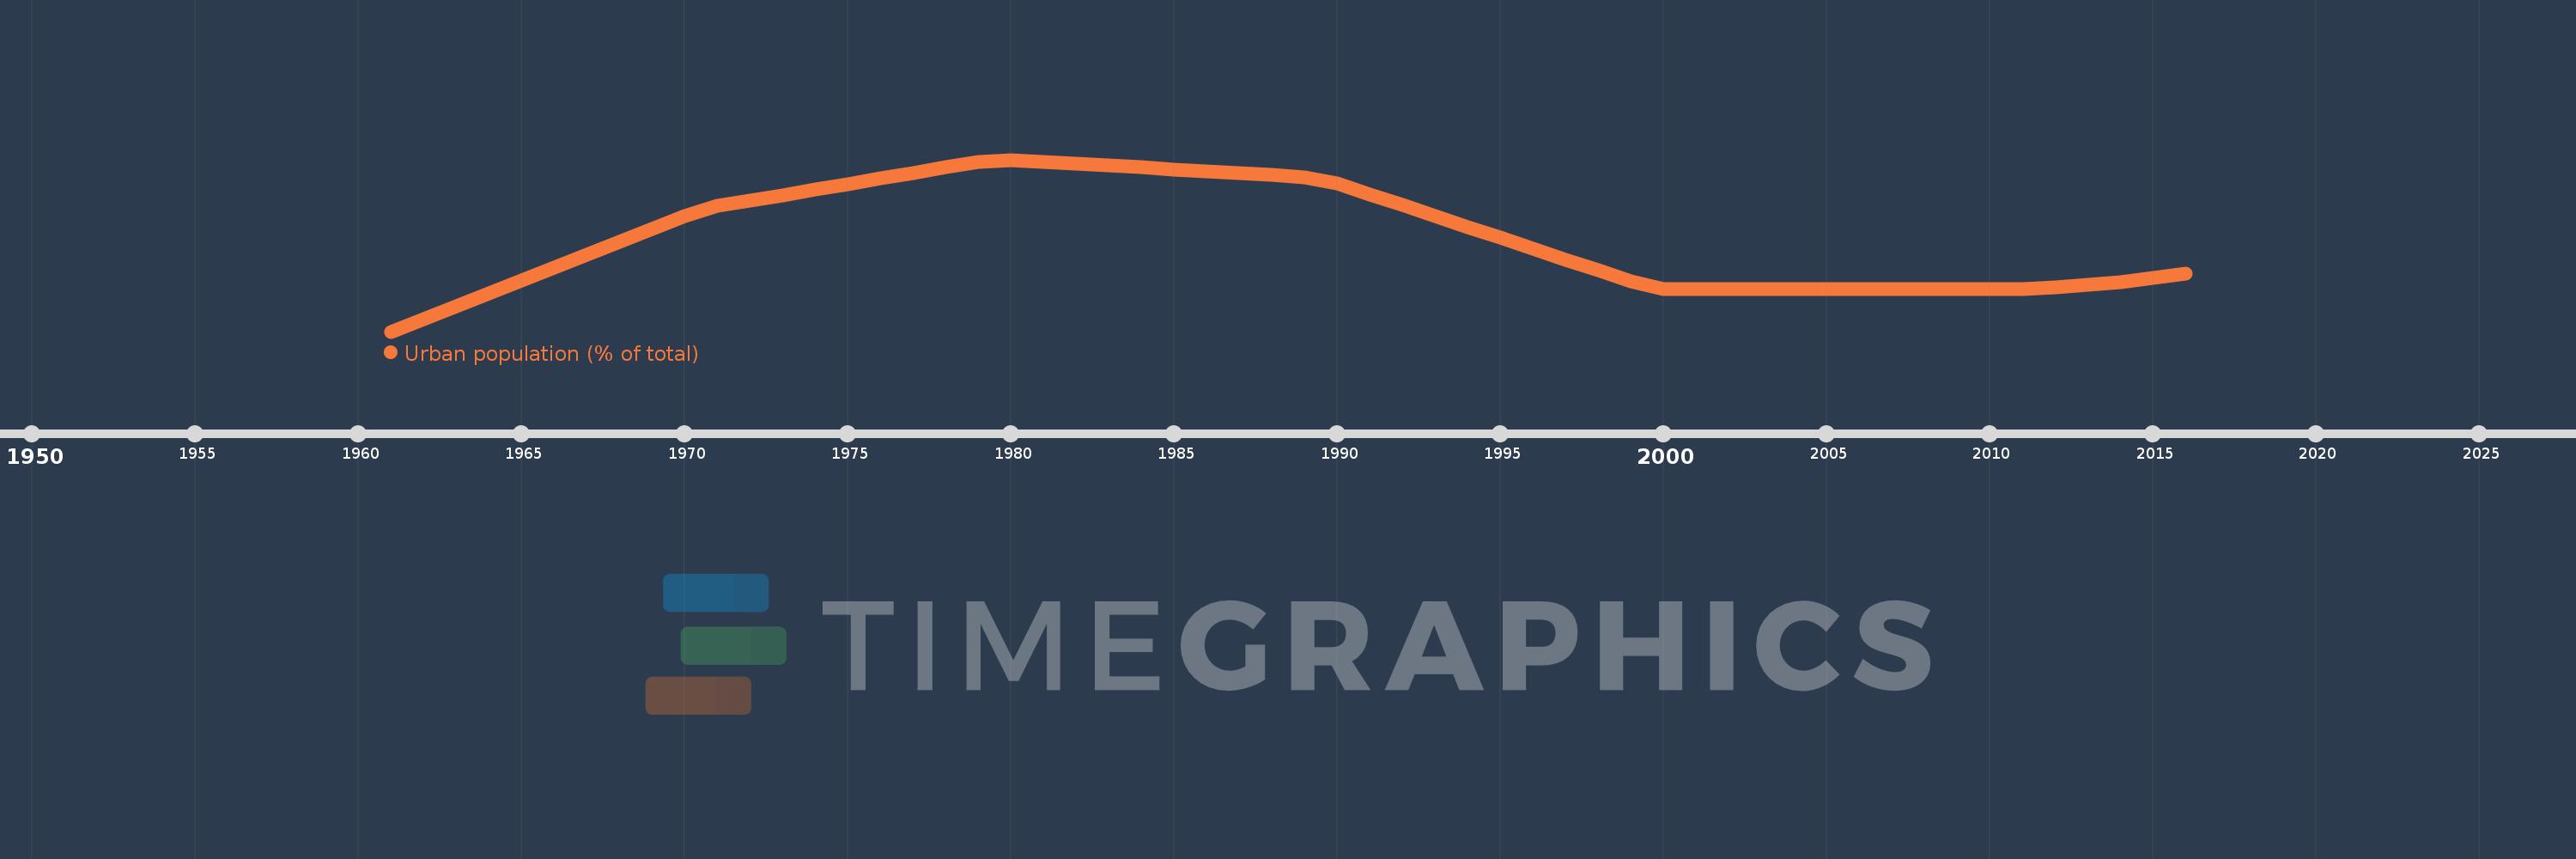
Urban population (% of total)
2016,2015,2014,2013,2012,2011,2010,2009,2008,2007,2006,2005,2004,2003,2002,2001,2000,1999,1998,1997,1996,1995,1994,1993,1992,1991,1990,1989,1988,1987,1986,1985,1984,1983,1982,1981,1980,1979,1978,1977,1976,1975,1974,1973,1972,1971,1970,1969,1968,1967,1966,1965,1964,1963,1962,1961
This statistics in other country:
AfghanistanAlbaniaAlgeriaAmerican SamoaAndorraAngolaAntigua and BarbudaArab WorldArgentinaArmeniaArubaAustraliaAustriaAzerbaijanBahamas, TheBahrainBangladeshBarbadosBelarusBelgiumBelizeBeninBermudaBhutanBoliviaBosnia and HerzegovinaBotswanaBrazilBritish Virgin IslandsBrunei DarussalamBulgariaBurkina FasoBurundiCabo VerdeCambodiaCameroonCanadaCaribbean small statesCayman IslandsCentral African RepublicCentral Europe and the BalticsChadChannel IslandsChileChinaColombiaComorosCongo, Dem. Rep.Congo, Rep.Costa RicaCote d'IvoireCroatiaCubaCuracaoCyprusCzech RepublicDenmarkDjiboutiDominicaDominican RepublicEarly-demographic dividendEast Asia & PacificEast Asia & Pacific (excluding high income)East Asia & Pacific (IDA & IBRD countries)EcuadorEgypt, Arab Rep.El SalvadorEquatorial GuineaEritreaEstoniaEthiopiaEuro areaEurope & Central AsiaEurope & Central Asia (excluding high income)Europe & Central Asia (IDA & IBRD countries)European UnionFaroe IslandsFijiFinlandFragile and conflict affected situationsFranceFrench PolynesiaGabonGambia, TheGeorgiaGermanyGhanaGibraltarGreeceGreenlandGrenadaGuamGuatemalaGuineaGuinea-BissauGuyanaHaitiHeavily indebted poor countries (HIPC)High incomeHondurasHong Kong SAR, ChinaHungaryIBRD onlyIcelandIDA & IBRD totalIDA blendIDA onlyIDA totalIndiaIndonesiaIran, Islamic Rep.IraqIrelandIsle of ManIsraelItalyJamaicaJapanJordanKazakhstanKenyaKiribatiKorea, Dem. People’s Rep.Korea, Rep.KuwaitKyrgyz RepublicLao PDRLate-demographic dividendLatin America & Caribbean Latin America & Caribbean (excluding high income)Latin America & the Caribbean (IDA & IBRD countries)LatviaLeast developed countries: UN classificationLebanonLesothoLiberiaLibyaLiechtensteinLithuaniaLow & middle incomeLow incomeLower middle incomeLuxembourgMacao SAR, ChinaMacedonia, FYRMadagascarMalawiMalaysiaMaldivesMaliMaltaMarshall IslandsMauritaniaMauritiusMexicoMicronesia, Fed. Sts.Middle East & North AfricaMiddle East & North Africa (excluding high income)Middle East & North Africa (IDA & IBRD countries)Middle incomeMoldovaMonacoMongoliaMontenegroMoroccoMozambiqueMyanmarNamibiaNauruNepalNetherlandsNew CaledoniaNew ZealandNicaraguaNigerNigeriaNorth AmericaNorthern Mariana IslandsNorwayOECD membersOmanOther small statesPacific island small statesPakistanPalauPanamaPapua New GuineaParaguayPeruPhilippinesPolandPortugalPost-demographic dividendPre-demographic dividendPuerto RicoQatarRomaniaRussian FederationRwandaSamoaSan MarinoSao Tome and PrincipeSaudi ArabiaSenegalSerbiaSeychellesSierra LeoneSingaporeSint Maarten (Dutch part)Slovak RepublicSloveniaSmall statesSolomon IslandsSomaliaSouth AfricaSouth AsiaSouth Asia (IDA & IBRD)South SudanSpainSri LankaSt. Kitts and NevisSt. LuciaSt. Vincent and the GrenadinesSub-Saharan Africa Sub-Saharan Africa (excluding high income)Sub-Saharan Africa (IDA & IBRD countries)SudanSurinameSwazilandSwedenSwitzerlandSyrian Arab RepublicTajikistanTanzaniaThailandTimor-LesteTogoTongaTrinidad and TobagoTunisiaTurkeyTurkmenistanTurks and Caicos IslandsTuvaluUgandaUkraineUnited Arab EmiratesUnited KingdomUnited StatesUpper middle incomeUruguayUzbekistanVanuatuVenezuela, RBVietnamVirgin Islands (U.S.)West Bank and GazaWorldYemen, Rep.ZambiaZimbabwe Timeline:
This timeline shows a graph from 1961 to 2016 of Kyrgyz Republic. No data until 1960. Number of actual observations by date: 56.
Source name:
World Development Indicators
Source organization:
United Nations, World Urbanization Prospects.
Categories, topics:
Climate Change, Urban Development
Last updated:
apr 23, 2017
Indicators value changes by year
Minimum:
34.181
jan 1, 1961
Maximum:
38.677
jan 1, 1980
At the date of observation
Value
Absolute change
Change from previous value
jan 1, 1961
34.181
+34.181
0.0%
jan 1, 1962
34.511
+0.33
0.97%
jan 1, 1963
34.844
+0.333
0.96%
jan 1, 1964
35.178
+0.334
0.96%
jan 1, 1965
35.515
+0.337
0.96%
jan 1, 1966
35.851
+0.336
0.95%
jan 1, 1967
36.19
+0.339
0.95%
jan 1, 1968
36.53
+0.34
0.94%
jan 1, 1969
36.871
+0.341
0.93%
jan 1, 1970
37.214
+0.343
0.93%
jan 1, 1971
37.466
+0.252
0.68%
jan 1, 1972
37.609
+0.143
0.38%
jan 1, 1973
37.753
+0.144
0.38%
jan 1, 1974
37.897
+0.144
0.38%
jan 1, 1975
38.042
+0.145
0.38%
jan 1, 1976
38.186
+0.144
0.38%
jan 1, 1977
38.331
+0.145
0.38%
jan 1, 1978
38.476
+0.145
0.38%
jan 1, 1979
38.621
+0.145
0.38%
jan 1, 1980
38.677
+0.056
0.14%
jan 1, 1981
38.627
-0.05
-0.13%
jan 1, 1982
38.577
-0.05
-0.13%
jan 1, 1983
38.527
-0.05
-0.13%
jan 1, 1984
38.477
-0.05
-0.13%
jan 1, 1985
38.427
-0.05
-0.13%
jan 1, 1986
38.377
-0.05
-0.13%
jan 1, 1987
38.327
-0.05
-0.13%
jan 1, 1988
38.277
-0.05
-0.13%
jan 1, 1989
38.227
-0.05
-0.13%
jan 1, 1990
38.065
-0.162
-0.42%
jan 1, 1991
37.777
-0.288
-0.76%
jan 1, 1992
37.49
-0.287
-0.76%
jan 1, 1993
37.203
-0.287
-0.77%
jan 1, 1994
36.918
-0.285
-0.77%
jan 1, 1995
36.633
-0.285
-0.77%
jan 1, 1996
36.349
-0.284
-0.78%
jan 1, 1997
36.066
-0.283
-0.78%
jan 1, 1998
35.785
-0.281
-0.78%
jan 1, 1999
35.504
-0.281
-0.79%
jan 1, 2000
35.3
-0.204
-0.57%
jan 1, 2001
35.298
-0.002
-0.01%
jan 1, 2002
35.296
-0.002
-0.01%
jan 1, 2003
35.295
-0.001
0.0%
jan 1, 2004
35.293
-0.002
-0.01%
jan 1, 2005
35.292
-0.001
0.0%
jan 1, 2006
35.29
-0.002
-0.01%
jan 1, 2007
35.289
-0.001
0.0%
jan 1, 2008
35.287
-0.002
-0.01%
jan 1, 2009
35.285
-0.002
-0.01%
jan 1, 2010
35.284
-0.001
0.0%
jan 1, 2011
35.303
+0.019
0.05%
jan 1, 2012
35.342
+0.039
0.11%
jan 1, 2013
35.403
+0.061
0.17%
jan 1, 2014
35.483
+0.08
0.23%
jan 1, 2015
35.585
+0.102
0.29%
jan 1, 2016
35.707
+0.122
0.34%
Ranking of countries by current statistics by years


Comments: