29
/
en
AIzaSyAYiBZKx7MnpbEhh9jyipgxe19OcubqV5w
April 1, 2024
240121
Sierra Leone
SLE
true
2
1
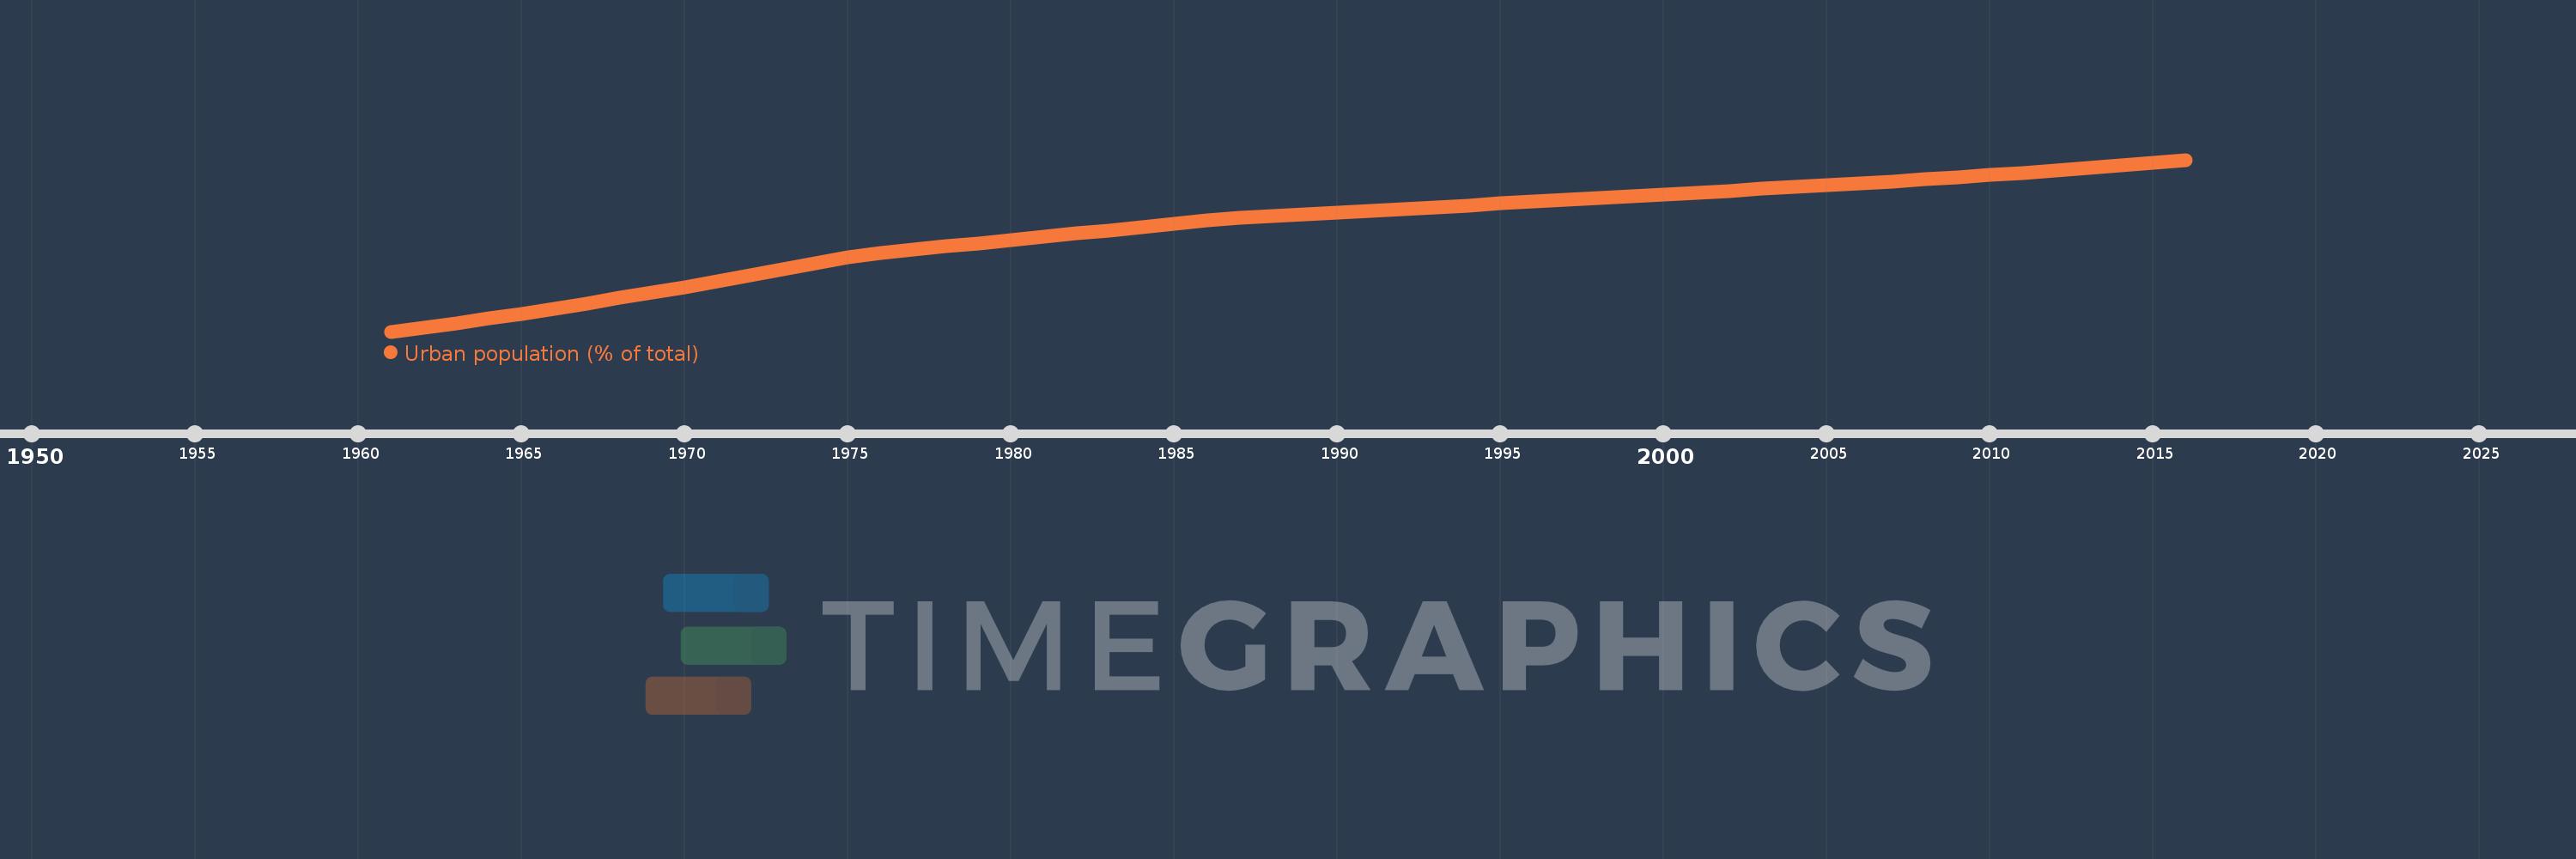
Urban population (% of total)
2016,2015,2014,2013,2012,2011,2010,2009,2008,2007,2006,2005,2004,2003,2002,2001,2000,1999,1998,1997,1996,1995,1994,1993,1992,1991,1990,1989,1988,1987,1986,1985,1984,1983,1982,1981,1980,1979,1978,1977,1976,1975,1974,1973,1972,1971,1970,1969,1968,1967,1966,1965,1964,1963,1962,1961
This statistics in other country:
AfghanistanAlbaniaAlgeriaAmerican SamoaAndorraAngolaAntigua and BarbudaArab WorldArgentinaArmeniaArubaAustraliaAustriaAzerbaijanBahamas, TheBahrainBangladeshBarbadosBelarusBelgiumBelizeBeninBermudaBhutanBoliviaBosnia and HerzegovinaBotswanaBrazilBritish Virgin IslandsBrunei DarussalamBulgariaBurkina FasoBurundiCabo VerdeCambodiaCameroonCanadaCaribbean small statesCayman IslandsCentral African RepublicCentral Europe and the BalticsChadChannel IslandsChileChinaColombiaComorosCongo, Dem. Rep.Congo, Rep.Costa RicaCote d'IvoireCroatiaCubaCuracaoCyprusCzech RepublicDenmarkDjiboutiDominicaDominican RepublicEarly-demographic dividendEast Asia & PacificEast Asia & Pacific (excluding high income)East Asia & Pacific (IDA & IBRD countries)EcuadorEgypt, Arab Rep.El SalvadorEquatorial GuineaEritreaEstoniaEthiopiaEuro areaEurope & Central AsiaEurope & Central Asia (excluding high income)Europe & Central Asia (IDA & IBRD countries)European UnionFaroe IslandsFijiFinlandFragile and conflict affected situationsFranceFrench PolynesiaGabonGambia, TheGeorgiaGermanyGhanaGibraltarGreeceGreenlandGrenadaGuamGuatemalaGuineaGuinea-BissauGuyanaHaitiHeavily indebted poor countries (HIPC)High incomeHondurasHong Kong SAR, ChinaHungaryIBRD onlyIcelandIDA & IBRD totalIDA blendIDA onlyIDA totalIndiaIndonesiaIran, Islamic Rep.IraqIrelandIsle of ManIsraelItalyJamaicaJapanJordanKazakhstanKenyaKiribatiKorea, Dem. People’s Rep.Korea, Rep.KuwaitKyrgyz RepublicLao PDRLate-demographic dividendLatin America & Caribbean Latin America & Caribbean (excluding high income)Latin America & the Caribbean (IDA & IBRD countries)LatviaLeast developed countries: UN classificationLebanonLesothoLiberiaLibyaLiechtensteinLithuaniaLow & middle incomeLow incomeLower middle incomeLuxembourgMacao SAR, ChinaMacedonia, FYRMadagascarMalawiMalaysiaMaldivesMaliMaltaMarshall IslandsMauritaniaMauritiusMexicoMicronesia, Fed. Sts.Middle East & North AfricaMiddle East & North Africa (excluding high income)Middle East & North Africa (IDA & IBRD countries)Middle incomeMoldovaMonacoMongoliaMontenegroMoroccoMozambiqueMyanmarNamibiaNauruNepalNetherlandsNew CaledoniaNew ZealandNicaraguaNigerNigeriaNorth AmericaNorthern Mariana IslandsNorwayOECD membersOmanOther small statesPacific island small statesPakistanPalauPanamaPapua New GuineaParaguayPeruPhilippinesPolandPortugalPost-demographic dividendPre-demographic dividendPuerto RicoQatarRomaniaRussian FederationRwandaSamoaSan MarinoSao Tome and PrincipeSaudi ArabiaSenegalSerbiaSeychellesSierra LeoneSingaporeSint Maarten (Dutch part)Slovak RepublicSloveniaSmall statesSolomon IslandsSomaliaSouth AfricaSouth AsiaSouth Asia (IDA & IBRD)South SudanSpainSri LankaSt. Kitts and NevisSt. LuciaSt. Vincent and the GrenadinesSub-Saharan Africa Sub-Saharan Africa (excluding high income)Sub-Saharan Africa (IDA & IBRD countries)SudanSurinameSwazilandSwedenSwitzerlandSyrian Arab RepublicTajikistanTanzaniaThailandTimor-LesteTogoTongaTrinidad and TobagoTunisiaTurkeyTurkmenistanTurks and Caicos IslandsTuvaluUgandaUkraineUnited Arab EmiratesUnited KingdomUnited StatesUpper middle incomeUruguayUzbekistanVanuatuVenezuela, RBVietnamVirgin Islands (U.S.)West Bank and GazaWorldYemen, Rep.ZambiaZimbabwe Timeline:
This timeline shows a graph from 1961 to 2016 of Sierra Leone. No data until 1960. Number of actual observations by date: 56.
Source name:
World Development Indicators
Source organization:
United Nations, World Urbanization Prospects.
Categories, topics:
Climate Change, Urban Development
Last updated:
apr 23, 2017
Indicators value changes by year
Minimum:
17.352
jan 1, 1961
Maximum:
39.942
jan 1, 2016
At the date of observation
Value
Absolute change
Change from previous value
jan 1, 1961
17.352
+17.352
0.0%
jan 1, 1962
17.903
+0.551
3.18%
jan 1, 1963
18.467
+0.564
3.15%
jan 1, 1964
19.06
+0.593
3.21%
jan 1, 1965
19.712
+0.652
3.42%
jan 1, 1966
20.379
+0.667
3.38%
jan 1, 1967
21.064
+0.685
3.36%
jan 1, 1968
21.765
+0.701
3.33%
jan 1, 1969
22.484
+0.719
3.3%
jan 1, 1970
23.218
+0.734
3.26%
jan 1, 1971
23.969
+0.751
3.23%
jan 1, 1972
24.737
+0.768
3.2%
jan 1, 1973
25.522
+0.785
3.17%
jan 1, 1974
26.321
+0.799
3.13%
jan 1, 1975
27.137
+0.816
3.1%
jan 1, 1976
27.729
+0.592
2.18%
jan 1, 1977
28.14
+0.411
1.48%
jan 1, 1978
28.554
+0.414
1.47%
jan 1, 1979
28.972
+0.418
1.46%
jan 1, 1980
29.394
+0.422
1.46%
jan 1, 1981
29.819
+0.425
1.45%
jan 1, 1982
30.248
+0.429
1.44%
jan 1, 1983
30.68
+0.432
1.43%
jan 1, 1984
31.115
+0.435
1.42%
jan 1, 1985
31.555
+0.44
1.41%
jan 1, 1986
31.997
+0.442
1.4%
jan 1, 1987
32.325
+0.328
1.03%
jan 1, 1988
32.555
+0.23
0.71%
jan 1, 1989
32.787
+0.232
0.71%
jan 1, 1990
33.019
+0.232
0.71%
jan 1, 1991
33.252
+0.233
0.71%
jan 1, 1992
33.485
+0.233
0.7%
jan 1, 1993
33.72
+0.235
0.7%
jan 1, 1994
33.955
+0.235
0.7%
jan 1, 1995
34.192
+0.237
0.7%
jan 1, 1996
34.429
+0.237
0.69%
jan 1, 1997
34.667
+0.238
0.69%
jan 1, 1998
34.905
+0.238
0.69%
jan 1, 1999
35.144
+0.239
0.68%
jan 1, 2000
35.384
+0.24
0.68%
jan 1, 2001
35.626
+0.242
0.68%
jan 1, 2002
35.867
+0.241
0.68%
jan 1, 2003
36.109
+0.242
0.67%
jan 1, 2004
36.352
+0.243
0.67%
jan 1, 2005
36.596
+0.244
0.67%
jan 1, 2006
36.84
+0.244
0.67%
jan 1, 2007
37.096
+0.256
0.69%
jan 1, 2008
37.364
+0.268
0.72%
jan 1, 2009
37.645
+0.281
0.75%
jan 1, 2010
37.937
+0.292
0.78%
jan 1, 2011
38.241
+0.304
0.8%
jan 1, 2012
38.557
+0.316
0.83%
jan 1, 2013
38.885
+0.328
0.85%
jan 1, 2014
39.226
+0.341
0.88%
jan 1, 2015
39.578
+0.352
0.9%
jan 1, 2016
39.942
+0.364
0.92%
Ranking of countries by current statistics by years


Comments: