29
/
en
AIzaSyAYiBZKx7MnpbEhh9jyipgxe19OcubqV5w
April 1, 2024
98113
Cabo Verde
CPV
true
2
1
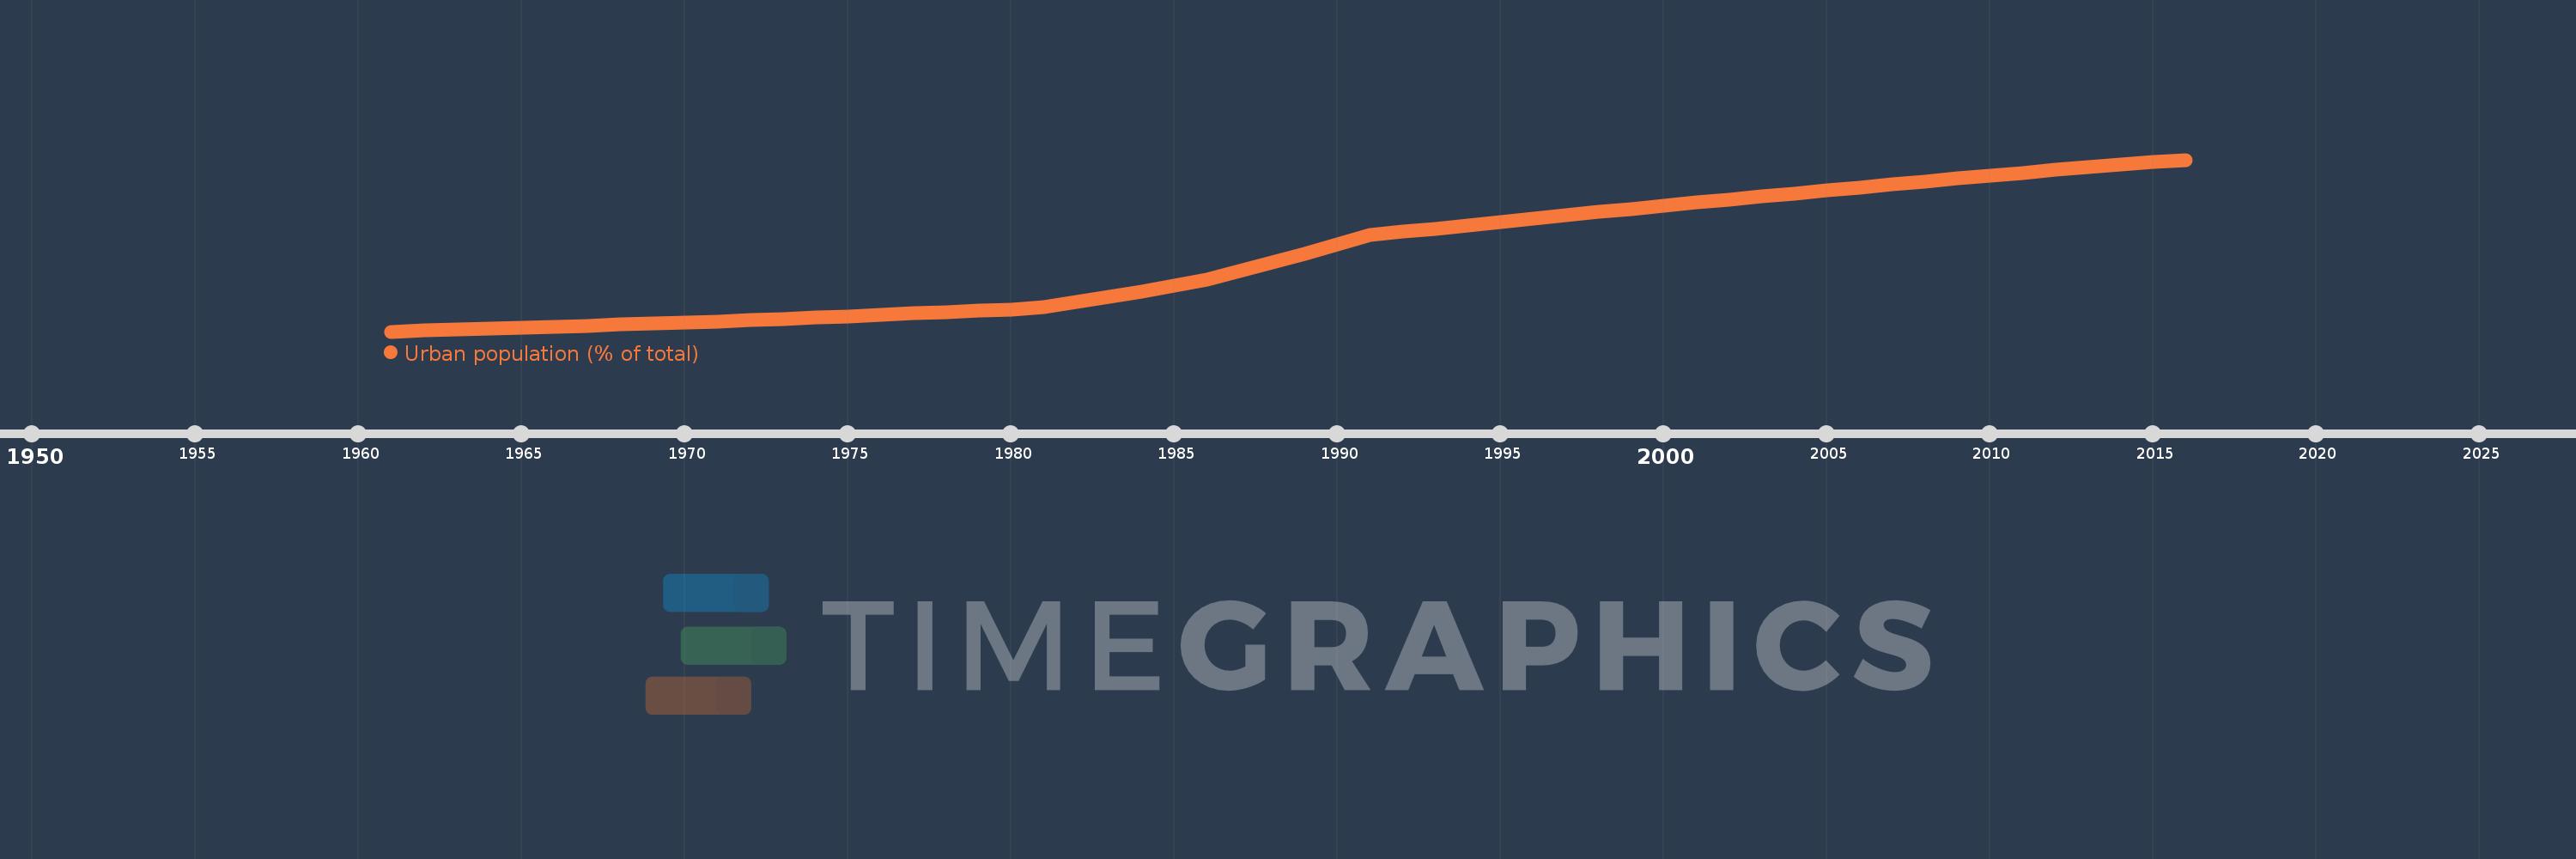
Urban population (% of total)
2016,2015,2014,2013,2012,2011,2010,2009,2008,2007,2006,2005,2004,2003,2002,2001,2000,1999,1998,1997,1996,1995,1994,1993,1992,1991,1990,1989,1988,1987,1986,1985,1984,1983,1982,1981,1980,1979,1978,1977,1976,1975,1974,1973,1972,1971,1970,1969,1968,1967,1966,1965,1964,1963,1962,1961
This statistics in other country:
AfghanistanAlbaniaAlgeriaAmerican SamoaAndorraAngolaAntigua and BarbudaArab WorldArgentinaArmeniaArubaAustraliaAustriaAzerbaijanBahamas, TheBahrainBangladeshBarbadosBelarusBelgiumBelizeBeninBermudaBhutanBoliviaBosnia and HerzegovinaBotswanaBrazilBritish Virgin IslandsBrunei DarussalamBulgariaBurkina FasoBurundiCabo VerdeCambodiaCameroonCanadaCaribbean small statesCayman IslandsCentral African RepublicCentral Europe and the BalticsChadChannel IslandsChileChinaColombiaComorosCongo, Dem. Rep.Congo, Rep.Costa RicaCote d'IvoireCroatiaCubaCuracaoCyprusCzech RepublicDenmarkDjiboutiDominicaDominican RepublicEarly-demographic dividendEast Asia & PacificEast Asia & Pacific (excluding high income)East Asia & Pacific (IDA & IBRD countries)EcuadorEgypt, Arab Rep.El SalvadorEquatorial GuineaEritreaEstoniaEthiopiaEuro areaEurope & Central AsiaEurope & Central Asia (excluding high income)Europe & Central Asia (IDA & IBRD countries)European UnionFaroe IslandsFijiFinlandFragile and conflict affected situationsFranceFrench PolynesiaGabonGambia, TheGeorgiaGermanyGhanaGibraltarGreeceGreenlandGrenadaGuamGuatemalaGuineaGuinea-BissauGuyanaHaitiHeavily indebted poor countries (HIPC)High incomeHondurasHong Kong SAR, ChinaHungaryIBRD onlyIcelandIDA & IBRD totalIDA blendIDA onlyIDA totalIndiaIndonesiaIran, Islamic Rep.IraqIrelandIsle of ManIsraelItalyJamaicaJapanJordanKazakhstanKenyaKiribatiKorea, Dem. People’s Rep.Korea, Rep.KuwaitKyrgyz RepublicLao PDRLate-demographic dividendLatin America & Caribbean Latin America & Caribbean (excluding high income)Latin America & the Caribbean (IDA & IBRD countries)LatviaLeast developed countries: UN classificationLebanonLesothoLiberiaLibyaLiechtensteinLithuaniaLow & middle incomeLow incomeLower middle incomeLuxembourgMacao SAR, ChinaMacedonia, FYRMadagascarMalawiMalaysiaMaldivesMaliMaltaMarshall IslandsMauritaniaMauritiusMexicoMicronesia, Fed. Sts.Middle East & North AfricaMiddle East & North Africa (excluding high income)Middle East & North Africa (IDA & IBRD countries)Middle incomeMoldovaMonacoMongoliaMontenegroMoroccoMozambiqueMyanmarNamibiaNauruNepalNetherlandsNew CaledoniaNew ZealandNicaraguaNigerNigeriaNorth AmericaNorthern Mariana IslandsNorwayOECD membersOmanOther small statesPacific island small statesPakistanPalauPanamaPapua New GuineaParaguayPeruPhilippinesPolandPortugalPost-demographic dividendPre-demographic dividendPuerto RicoQatarRomaniaRussian FederationRwandaSamoaSan MarinoSao Tome and PrincipeSaudi ArabiaSenegalSerbiaSeychellesSierra LeoneSingaporeSint Maarten (Dutch part)Slovak RepublicSloveniaSmall statesSolomon IslandsSomaliaSouth AfricaSouth AsiaSouth Asia (IDA & IBRD)South SudanSpainSri LankaSt. Kitts and NevisSt. LuciaSt. Vincent and the GrenadinesSub-Saharan Africa Sub-Saharan Africa (excluding high income)Sub-Saharan Africa (IDA & IBRD countries)SudanSurinameSwazilandSwedenSwitzerlandSyrian Arab RepublicTajikistanTanzaniaThailandTimor-LesteTogoTongaTrinidad and TobagoTunisiaTurkeyTurkmenistanTurks and Caicos IslandsTuvaluUgandaUkraineUnited Arab EmiratesUnited KingdomUnited StatesUpper middle incomeUruguayUzbekistanVanuatuVenezuela, RBVietnamVirgin Islands (U.S.)West Bank and GazaWorldYemen, Rep.ZambiaZimbabwe Timeline:
This timeline shows a graph from 1961 to 2016 of Cabo Verde. No data until 1960. Number of actual observations by date: 56.
Source name:
World Development Indicators
Source organization:
United Nations, World Urbanization Prospects.
Categories, topics:
Climate Change, Urban Development
Last updated:
apr 23, 2017
Indicators value changes by year
Minimum:
16.679
jan 1, 1961
Maximum:
65.526
jan 1, 2016
At the date of observation
Value
Absolute change
Change from previous value
jan 1, 1961
16.679
+16.679
0.0%
jan 1, 1962
16.948
+0.269
1.61%
jan 1, 1963
17.224
+0.276
1.63%
jan 1, 1964
17.503
+0.279
1.62%
jan 1, 1965
17.787
+0.284
1.62%
jan 1, 1966
18.073
+0.286
1.61%
jan 1, 1967
18.363
+0.29
1.6%
jan 1, 1968
18.657
+0.294
1.6%
jan 1, 1969
18.954
+0.297
1.59%
jan 1, 1970
19.255
+0.301
1.59%
jan 1, 1971
19.559
+0.304
1.58%
jan 1, 1972
19.9
+0.341
1.74%
jan 1, 1973
20.272
+0.372
1.87%
jan 1, 1974
20.649
+0.377
1.86%
jan 1, 1975
21.031
+0.382
1.85%
jan 1, 1976
21.419
+0.388
1.84%
jan 1, 1977
21.812
+0.393
1.83%
jan 1, 1978
22.209
+0.397
1.82%
jan 1, 1979
22.612
+0.403
1.81%
jan 1, 1980
23.02
+0.408
1.8%
jan 1, 1981
23.518
+0.498
2.16%
jan 1, 1982
24.995
+1.477
6.28%
jan 1, 1983
26.535
+1.54
6.16%
jan 1, 1984
28.133
+1.598
6.02%
jan 1, 1985
29.792
+1.659
5.9%
jan 1, 1986
31.5
+1.708
5.73%
jan 1, 1987
33.885
+2.385
7.57%
jan 1, 1988
36.355
+2.47
7.29%
jan 1, 1989
38.902
+2.547
7.01%
jan 1, 1990
41.504
+2.602
6.69%
jan 1, 1991
44.12
+2.616
6.3%
jan 1, 1992
45.044
+0.924
2.09%
jan 1, 1993
45.973
+0.929
2.06%
jan 1, 1994
46.902
+0.929
2.02%
jan 1, 1995
47.834
+0.932
1.99%
jan 1, 1996
48.768
+0.934
1.95%
jan 1, 1997
49.704
+0.936
1.92%
jan 1, 1998
50.637
+0.933
1.88%
jan 1, 1999
51.572
+0.935
1.85%
jan 1, 2000
52.505
+0.933
1.81%
jan 1, 2001
53.435
+0.93
1.77%
jan 1, 2002
54.291
+0.856
1.6%
jan 1, 2003
55.146
+0.855
1.57%
jan 1, 2004
55.997
+0.851
1.54%
jan 1, 2005
56.846
+0.849
1.52%
jan 1, 2006
57.689
+0.843
1.48%
jan 1, 2007
58.529
+0.84
1.46%
jan 1, 2008
59.363
+0.834
1.42%
jan 1, 2009
60.194
+0.831
1.4%
jan 1, 2010
61.016
+0.822
1.37%
jan 1, 2011
61.833
+0.817
1.34%
jan 1, 2012
62.624
+0.791
1.28%
jan 1, 2013
63.389
+0.765
1.22%
jan 1, 2014
64.127
+0.738
1.16%
jan 1, 2015
64.84
+0.713
1.11%
jan 1, 2016
65.526
+0.686
1.06%
Ranking of countries by current statistics by years


Comments: