29
/
en
AIzaSyAYiBZKx7MnpbEhh9jyipgxe19OcubqV5w
April 1, 2024
103182
Central African Republic
CAF
true
2
1
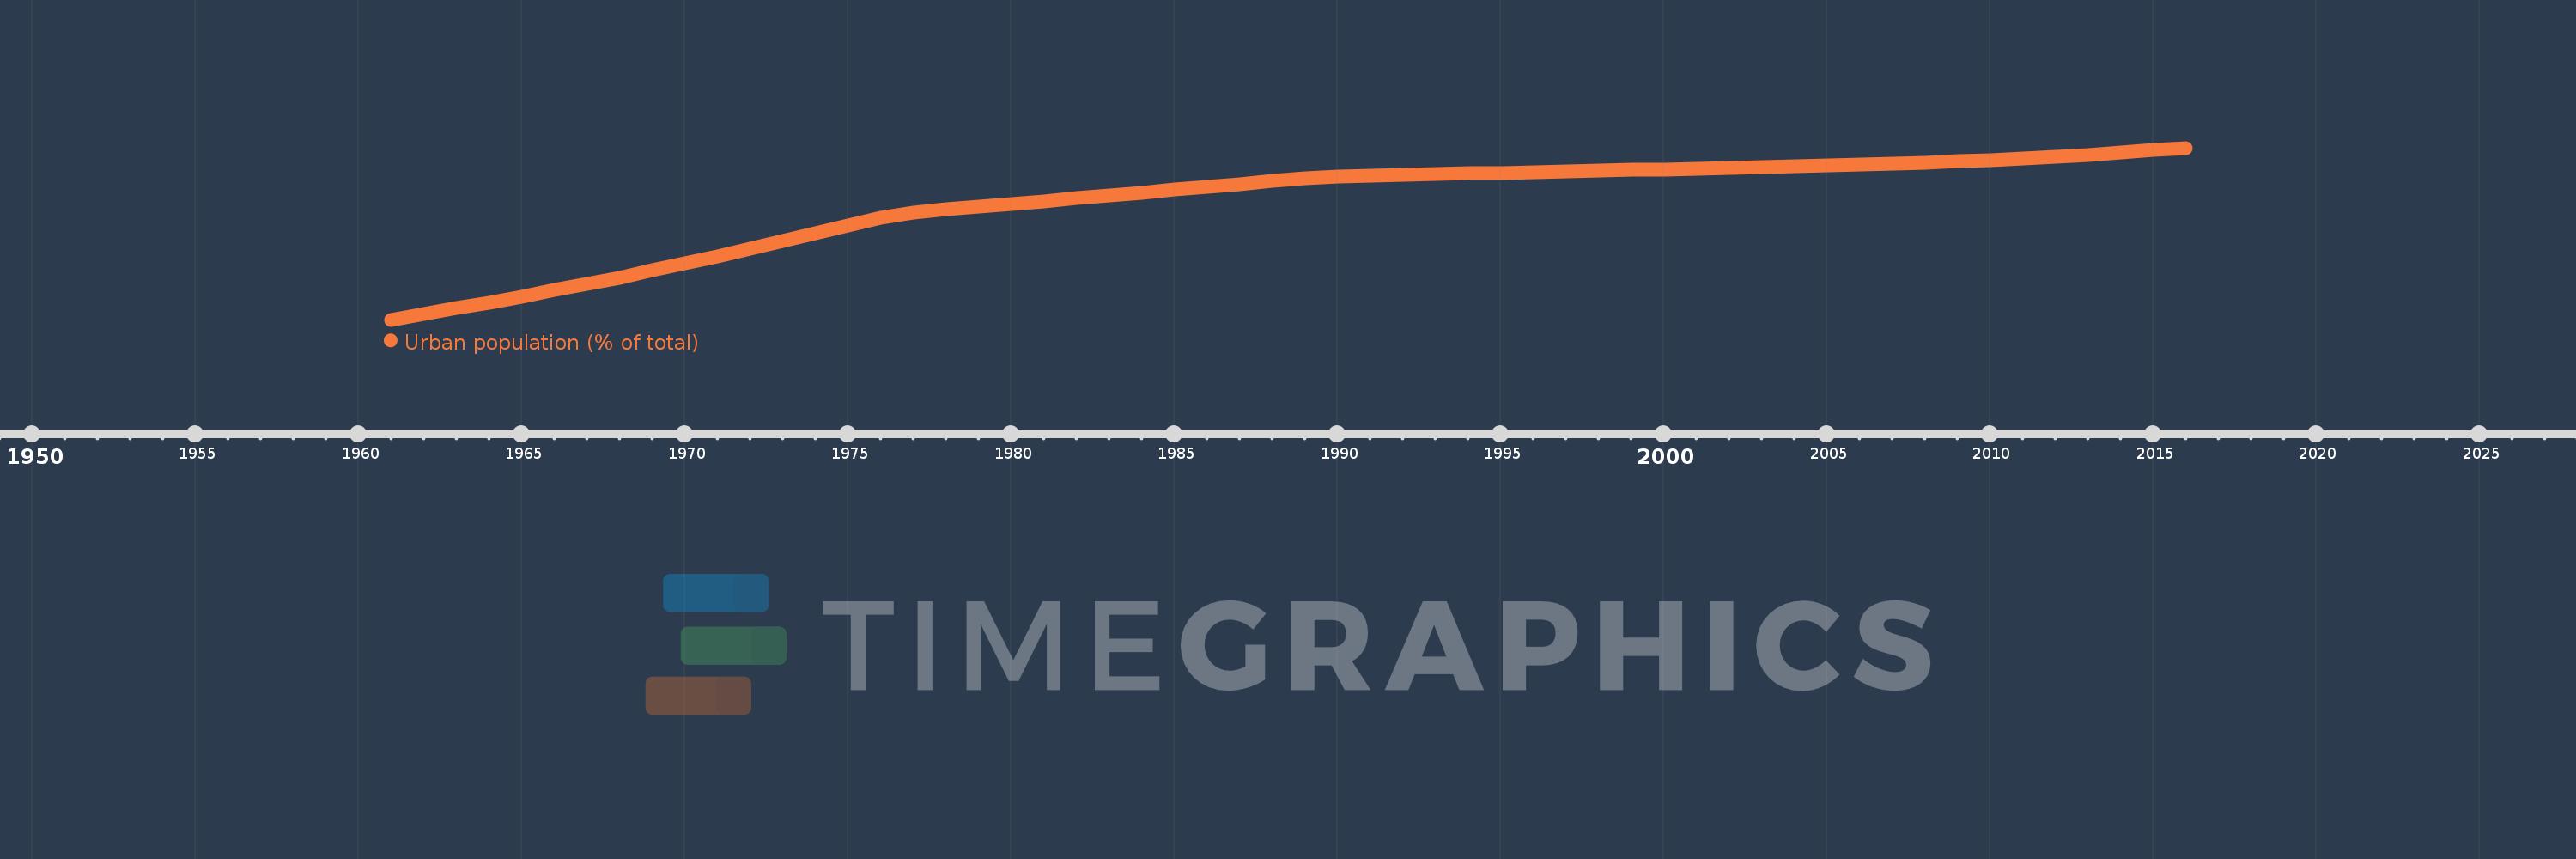
Urban population (% of total)
2016,2015,2014,2013,2012,2011,2010,2009,2008,2007,2006,2005,2004,2003,2002,2001,2000,1999,1998,1997,1996,1995,1994,1993,1992,1991,1990,1989,1988,1987,1986,1985,1984,1983,1982,1981,1980,1979,1978,1977,1976,1975,1974,1973,1972,1971,1970,1969,1968,1967,1966,1965,1964,1963,1962,1961
This statistics in other country:
AfghanistanAlbaniaAlgeriaAmerican SamoaAndorraAngolaAntigua and BarbudaArab WorldArgentinaArmeniaArubaAustraliaAustriaAzerbaijanBahamas, TheBahrainBangladeshBarbadosBelarusBelgiumBelizeBeninBermudaBhutanBoliviaBosnia and HerzegovinaBotswanaBrazilBritish Virgin IslandsBrunei DarussalamBulgariaBurkina FasoBurundiCabo VerdeCambodiaCameroonCanadaCaribbean small statesCayman IslandsCentral African RepublicCentral Europe and the BalticsChadChannel IslandsChileChinaColombiaComorosCongo, Dem. Rep.Congo, Rep.Costa RicaCote d'IvoireCroatiaCubaCuracaoCyprusCzech RepublicDenmarkDjiboutiDominicaDominican RepublicEarly-demographic dividendEast Asia & PacificEast Asia & Pacific (excluding high income)East Asia & Pacific (IDA & IBRD countries)EcuadorEgypt, Arab Rep.El SalvadorEquatorial GuineaEritreaEstoniaEthiopiaEuro areaEurope & Central AsiaEurope & Central Asia (excluding high income)Europe & Central Asia (IDA & IBRD countries)European UnionFaroe IslandsFijiFinlandFragile and conflict affected situationsFranceFrench PolynesiaGabonGambia, TheGeorgiaGermanyGhanaGibraltarGreeceGreenlandGrenadaGuamGuatemalaGuineaGuinea-BissauGuyanaHaitiHeavily indebted poor countries (HIPC)High incomeHondurasHong Kong SAR, ChinaHungaryIBRD onlyIcelandIDA & IBRD totalIDA blendIDA onlyIDA totalIndiaIndonesiaIran, Islamic Rep.IraqIrelandIsle of ManIsraelItalyJamaicaJapanJordanKazakhstanKenyaKiribatiKorea, Dem. People’s Rep.Korea, Rep.KuwaitKyrgyz RepublicLao PDRLate-demographic dividendLatin America & Caribbean Latin America & Caribbean (excluding high income)Latin America & the Caribbean (IDA & IBRD countries)LatviaLeast developed countries: UN classificationLebanonLesothoLiberiaLibyaLiechtensteinLithuaniaLow & middle incomeLow incomeLower middle incomeLuxembourgMacao SAR, ChinaMacedonia, FYRMadagascarMalawiMalaysiaMaldivesMaliMaltaMarshall IslandsMauritaniaMauritiusMexicoMicronesia, Fed. Sts.Middle East & North AfricaMiddle East & North Africa (excluding high income)Middle East & North Africa (IDA & IBRD countries)Middle incomeMoldovaMonacoMongoliaMontenegroMoroccoMozambiqueMyanmarNamibiaNauruNepalNetherlandsNew CaledoniaNew ZealandNicaraguaNigerNigeriaNorth AmericaNorthern Mariana IslandsNorwayOECD membersOmanOther small statesPacific island small statesPakistanPalauPanamaPapua New GuineaParaguayPeruPhilippinesPolandPortugalPost-demographic dividendPre-demographic dividendPuerto RicoQatarRomaniaRussian FederationRwandaSamoaSan MarinoSao Tome and PrincipeSaudi ArabiaSenegalSerbiaSeychellesSierra LeoneSingaporeSint Maarten (Dutch part)Slovak RepublicSloveniaSmall statesSolomon IslandsSomaliaSouth AfricaSouth AsiaSouth Asia (IDA & IBRD)South SudanSpainSri LankaSt. Kitts and NevisSt. LuciaSt. Vincent and the GrenadinesSub-Saharan Africa Sub-Saharan Africa (excluding high income)Sub-Saharan Africa (IDA & IBRD countries)SudanSurinameSwazilandSwedenSwitzerlandSyrian Arab RepublicTajikistanTanzaniaThailandTimor-LesteTogoTongaTrinidad and TobagoTunisiaTurkeyTurkmenistanTurks and Caicos IslandsTuvaluUgandaUkraineUnited Arab EmiratesUnited KingdomUnited StatesUpper middle incomeUruguayUzbekistanVanuatuVenezuela, RBVietnamVirgin Islands (U.S.)West Bank and GazaWorldYemen, Rep.ZambiaZimbabwe Timeline:
This timeline shows a graph from 1961 to 2016 of Central African Republic. No data until 1960. Number of actual observations by date: 56.
Source name:
World Development Indicators
Source organization:
United Nations, World Urbanization Prospects.
Categories, topics:
Climate Change, Urban Development
Last updated:
apr 23, 2017
Indicators value changes by year
Maximum:
40.037
jan 1, 2016
At the date of observation
Value
Absolute change
Change from previous value
jan 1, 1961
20.1
+20.1
0.0%
jan 1, 1962
20.751
+0.651
3.24%
jan 1, 1963
21.418
+0.667
3.21%
jan 1, 1964
22.1
+0.682
3.18%
jan 1, 1965
22.803
+0.703
3.18%
jan 1, 1966
23.519
+0.716
3.14%
jan 1, 1967
24.252
+0.733
3.12%
jan 1, 1968
25.0
+0.748
3.08%
jan 1, 1969
25.815
+0.815
3.26%
jan 1, 1970
26.645
+0.83
3.22%
jan 1, 1971
27.492
+0.847
3.18%
jan 1, 1972
28.356
+0.864
3.14%
jan 1, 1973
29.238
+0.882
3.11%
jan 1, 1974
30.133
+0.895
3.06%
jan 1, 1975
31.045
+0.912
3.03%
jan 1, 1976
31.971
+0.926
2.98%
jan 1, 1977
32.575
+0.604
1.89%
jan 1, 1978
32.897
+0.322
0.99%
jan 1, 1979
33.221
+0.324
0.98%
jan 1, 1980
33.546
+0.325
0.98%
jan 1, 1981
33.874
+0.328
0.98%
jan 1, 1982
34.202
+0.328
0.97%
jan 1, 1983
34.532
+0.33
0.96%
jan 1, 1984
34.864
+0.332
0.96%
jan 1, 1985
35.198
+0.334
0.96%
jan 1, 1986
35.532
+0.334
0.95%
jan 1, 1987
35.868
+0.336
0.95%
jan 1, 1988
36.206
+0.338
0.94%
jan 1, 1989
36.545
+0.339
0.94%
jan 1, 1990
36.744
+0.199
0.54%
jan 1, 1991
36.825
+0.081
0.22%
jan 1, 1992
36.906
+0.081
0.22%
jan 1, 1993
36.987
+0.081
0.22%
jan 1, 1994
37.068
+0.081
0.22%
jan 1, 1995
37.149
+0.081
0.22%
jan 1, 1996
37.231
+0.082
0.22%
jan 1, 1997
37.312
+0.081
0.22%
jan 1, 1998
37.394
+0.082
0.22%
jan 1, 1999
37.475
+0.081
0.22%
jan 1, 2000
37.557
+0.082
0.22%
jan 1, 2001
37.639
+0.082
0.22%
jan 1, 2002
37.72
+0.081
0.22%
jan 1, 2003
37.802
+0.082
0.22%
jan 1, 2004
37.884
+0.082
0.22%
jan 1, 2005
37.966
+0.082
0.22%
jan 1, 2006
38.066
+0.1
0.26%
jan 1, 2007
38.183
+0.117
0.31%
jan 1, 2008
38.318
+0.135
0.35%
jan 1, 2009
38.47
+0.152
0.4%
jan 1, 2010
38.64
+0.17
0.44%
jan 1, 2011
38.828
+0.188
0.49%
jan 1, 2012
39.034
+0.206
0.53%
jan 1, 2013
39.258
+0.224
0.57%
jan 1, 2014
39.5
+0.242
0.62%
jan 1, 2015
39.759
+0.259
0.66%
jan 1, 2016
40.037
+0.278
0.7%
Ranking of countries by current statistics by years


Comments: