29
/
en
AIzaSyAYiBZKx7MnpbEhh9jyipgxe19OcubqV5w
April 1, 2024
271297
Turks and Caicos Islands
TCA
true
2
1
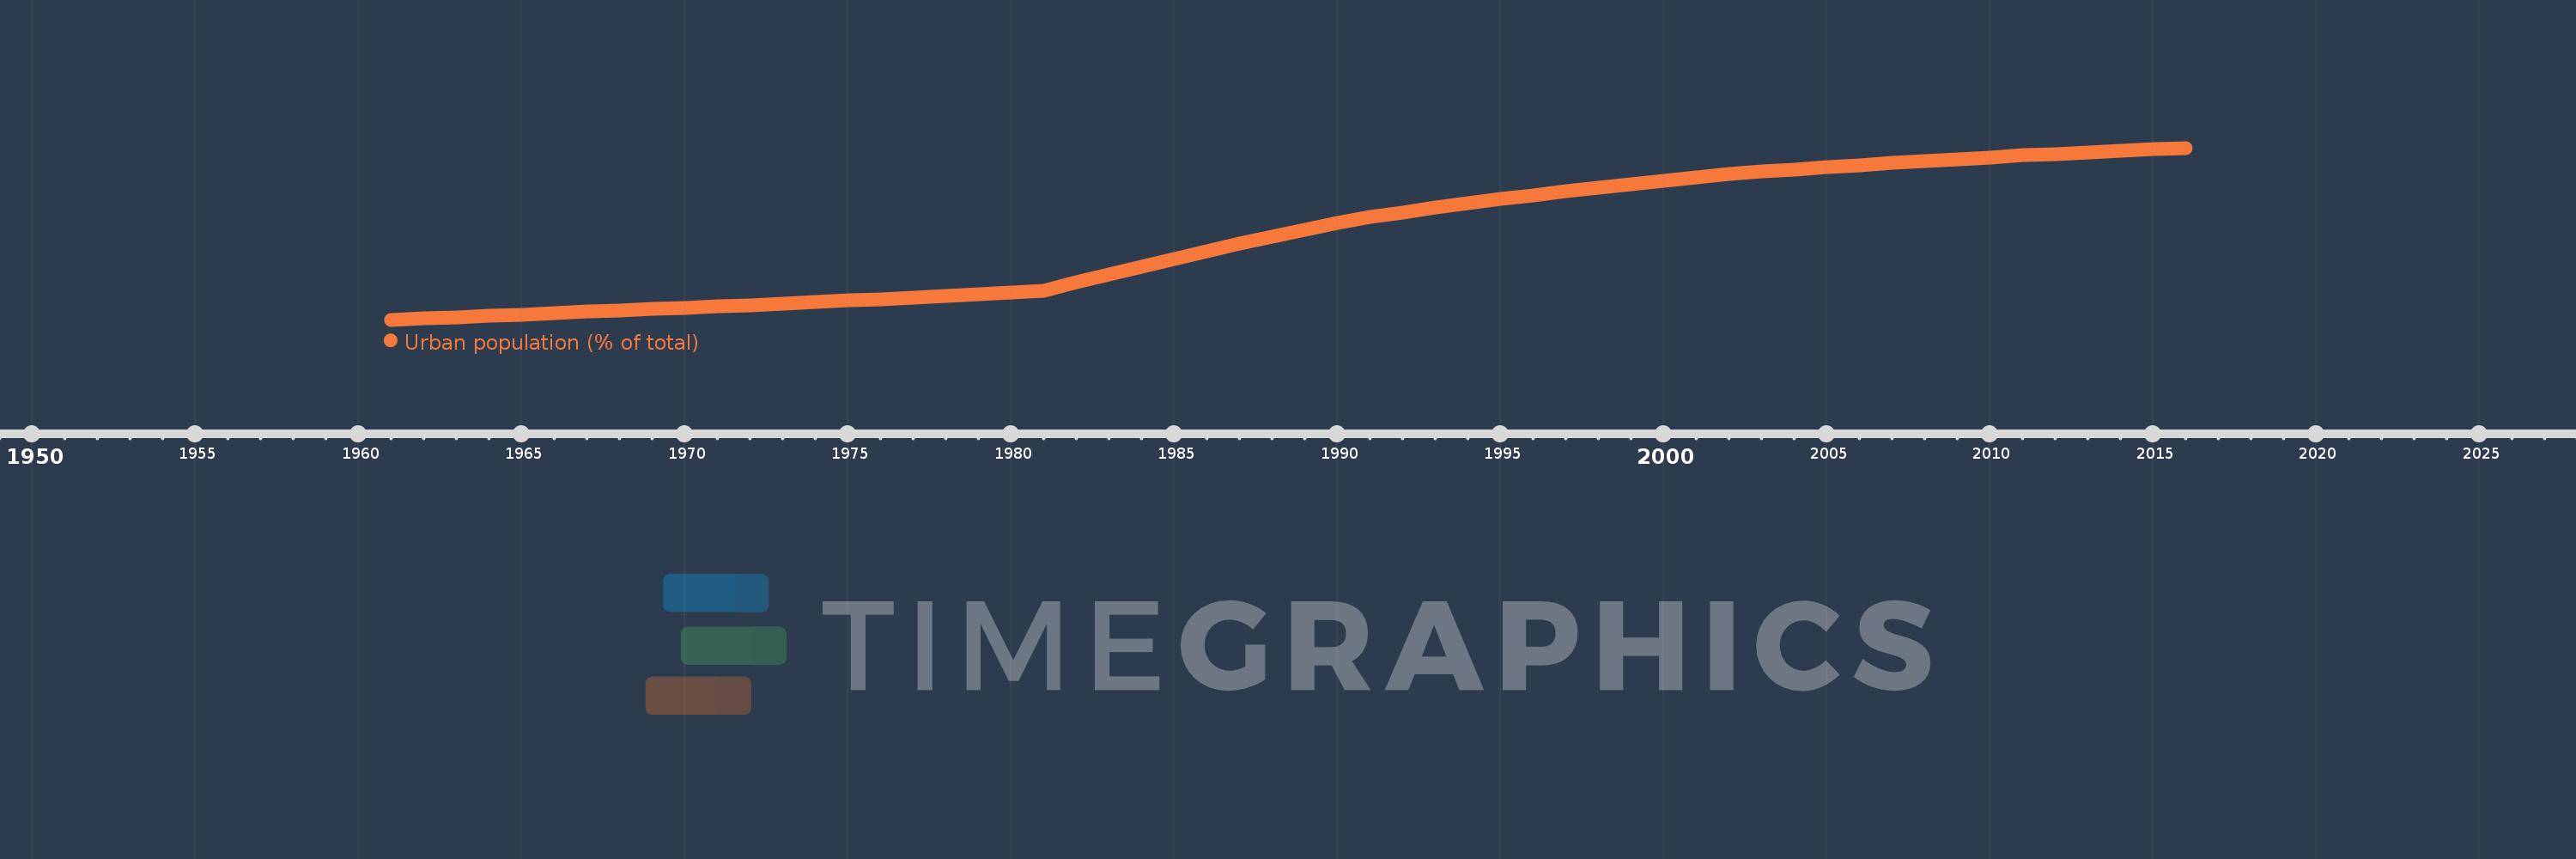
Urban population (% of total)
2016,2015,2014,2013,2012,2011,2010,2009,2008,2007,2006,2005,2004,2003,2002,2001,2000,1999,1998,1997,1996,1995,1994,1993,1992,1991,1990,1989,1988,1987,1986,1985,1984,1983,1982,1981,1980,1979,1978,1977,1976,1975,1974,1973,1972,1971,1970,1969,1968,1967,1966,1965,1964,1963,1962,1961
This statistics in other country:
AfghanistanAlbaniaAlgeriaAmerican SamoaAndorraAngolaAntigua and BarbudaArab WorldArgentinaArmeniaArubaAustraliaAustriaAzerbaijanBahamas, TheBahrainBangladeshBarbadosBelarusBelgiumBelizeBeninBermudaBhutanBoliviaBosnia and HerzegovinaBotswanaBrazilBritish Virgin IslandsBrunei DarussalamBulgariaBurkina FasoBurundiCabo VerdeCambodiaCameroonCanadaCaribbean small statesCayman IslandsCentral African RepublicCentral Europe and the BalticsChadChannel IslandsChileChinaColombiaComorosCongo, Dem. Rep.Congo, Rep.Costa RicaCote d'IvoireCroatiaCubaCuracaoCyprusCzech RepublicDenmarkDjiboutiDominicaDominican RepublicEarly-demographic dividendEast Asia & PacificEast Asia & Pacific (excluding high income)East Asia & Pacific (IDA & IBRD countries)EcuadorEgypt, Arab Rep.El SalvadorEquatorial GuineaEritreaEstoniaEthiopiaEuro areaEurope & Central AsiaEurope & Central Asia (excluding high income)Europe & Central Asia (IDA & IBRD countries)European UnionFaroe IslandsFijiFinlandFragile and conflict affected situationsFranceFrench PolynesiaGabonGambia, TheGeorgiaGermanyGhanaGibraltarGreeceGreenlandGrenadaGuamGuatemalaGuineaGuinea-BissauGuyanaHaitiHeavily indebted poor countries (HIPC)High incomeHondurasHong Kong SAR, ChinaHungaryIBRD onlyIcelandIDA & IBRD totalIDA blendIDA onlyIDA totalIndiaIndonesiaIran, Islamic Rep.IraqIrelandIsle of ManIsraelItalyJamaicaJapanJordanKazakhstanKenyaKiribatiKorea, Dem. People’s Rep.Korea, Rep.KuwaitKyrgyz RepublicLao PDRLate-demographic dividendLatin America & Caribbean Latin America & Caribbean (excluding high income)Latin America & the Caribbean (IDA & IBRD countries)LatviaLeast developed countries: UN classificationLebanonLesothoLiberiaLibyaLiechtensteinLithuaniaLow & middle incomeLow incomeLower middle incomeLuxembourgMacao SAR, ChinaMacedonia, FYRMadagascarMalawiMalaysiaMaldivesMaliMaltaMarshall IslandsMauritaniaMauritiusMexicoMicronesia, Fed. Sts.Middle East & North AfricaMiddle East & North Africa (excluding high income)Middle East & North Africa (IDA & IBRD countries)Middle incomeMoldovaMonacoMongoliaMontenegroMoroccoMozambiqueMyanmarNamibiaNauruNepalNetherlandsNew CaledoniaNew ZealandNicaraguaNigerNigeriaNorth AmericaNorthern Mariana IslandsNorwayOECD membersOmanOther small statesPacific island small statesPakistanPalauPanamaPapua New GuineaParaguayPeruPhilippinesPolandPortugalPost-demographic dividendPre-demographic dividendPuerto RicoQatarRomaniaRussian FederationRwandaSamoaSan MarinoSao Tome and PrincipeSaudi ArabiaSenegalSerbiaSeychellesSierra LeoneSingaporeSint Maarten (Dutch part)Slovak RepublicSloveniaSmall statesSolomon IslandsSomaliaSouth AfricaSouth AsiaSouth Asia (IDA & IBRD)South SudanSpainSri LankaSt. Kitts and NevisSt. LuciaSt. Vincent and the GrenadinesSub-Saharan Africa Sub-Saharan Africa (excluding high income)Sub-Saharan Africa (IDA & IBRD countries)SudanSurinameSwazilandSwedenSwitzerlandSyrian Arab RepublicTajikistanTanzaniaThailandTimor-LesteTogoTongaTrinidad and TobagoTunisiaTurkeyTurkmenistanTurks and Caicos IslandsTuvaluUgandaUkraineUnited Arab EmiratesUnited KingdomUnited StatesUpper middle incomeUruguayUzbekistanVanuatuVenezuela, RBVietnamVirgin Islands (U.S.)West Bank and GazaWorldYemen, Rep.ZambiaZimbabwe Timeline:
This timeline shows a graph from 1961 to 2016 of Turks and Caicos Islands. No data until 1960. Number of actual observations by date: 56.
Source name:
World Development Indicators
Source organization:
United Nations, World Urbanization Prospects.
Categories, topics:
Climate Change, Urban Development
Last updated:
apr 23, 2017
Indicators value changes by year
Minimum:
47.679
jan 1, 1961
Maximum:
92.186
jan 1, 2016
At the date of observation
Value
Absolute change
Change from previous value
jan 1, 1961
47.679
+47.679
0.0%
jan 1, 1962
48.021
+0.342
0.72%
jan 1, 1963
48.364
+0.343
0.71%
jan 1, 1964
48.706
+0.342
0.71%
jan 1, 1965
49.049
+0.343
0.7%
jan 1, 1966
49.392
+0.343
0.7%
jan 1, 1967
49.734
+0.342
0.69%
jan 1, 1968
50.077
+0.343
0.69%
jan 1, 1969
50.42
+0.343
0.68%
jan 1, 1970
50.763
+0.343
0.68%
jan 1, 1971
51.106
+0.343
0.68%
jan 1, 1972
51.487
+0.381
0.75%
jan 1, 1973
51.882
+0.395
0.77%
jan 1, 1974
52.275
+0.393
0.76%
jan 1, 1975
52.669
+0.394
0.75%
jan 1, 1976
53.063
+0.394
0.75%
jan 1, 1977
53.456
+0.393
0.74%
jan 1, 1978
53.848
+0.392
0.73%
jan 1, 1979
54.24
+0.392
0.73%
jan 1, 1980
54.632
+0.392
0.72%
jan 1, 1981
55.259
+0.627
1.15%
jan 1, 1982
57.358
+2.099
3.8%
jan 1, 1983
59.435
+2.077
3.62%
jan 1, 1984
61.478
+2.043
3.44%
jan 1, 1985
63.484
+2.006
3.26%
jan 1, 1986
65.439
+1.955
3.08%
jan 1, 1987
67.345
+1.906
2.91%
jan 1, 1988
69.197
+1.852
2.75%
jan 1, 1989
70.99
+1.793
2.59%
jan 1, 1990
72.716
+1.726
2.43%
jan 1, 1991
74.343
+1.627
2.24%
jan 1, 1992
75.537
+1.194
1.61%
jan 1, 1993
76.694
+1.157
1.53%
jan 1, 1994
77.81
+1.116
1.46%
jan 1, 1995
78.888
+1.078
1.39%
jan 1, 1996
79.928
+1.04
1.32%
jan 1, 1997
80.93
+1.002
1.25%
jan 1, 1998
81.89
+0.96
1.19%
jan 1, 1999
82.814
+0.924
1.13%
jan 1, 2000
83.7
+0.886
1.07%
jan 1, 2001
84.55
+0.85
1.02%
jan 1, 2002
85.362
+0.812
0.96%
jan 1, 2003
86.007
+0.645
0.76%
jan 1, 2004
86.608
+0.601
0.7%
jan 1, 2005
87.188
+0.58
0.67%
jan 1, 2006
87.745
+0.557
0.64%
jan 1, 2007
88.281
+0.536
0.61%
jan 1, 2008
88.797
+0.516
0.58%
jan 1, 2009
89.294
+0.497
0.56%
jan 1, 2010
89.77
+0.476
0.53%
jan 1, 2011
90.228
+0.458
0.51%
jan 1, 2012
90.668
+0.44
0.49%
jan 1, 2013
91.09
+0.422
0.47%
jan 1, 2014
91.482
+0.392
0.43%
jan 1, 2015
91.847
+0.365
0.4%
jan 1, 2016
92.186
+0.339
0.37%
Ranking of countries by current statistics by years


Comments: