29
/
en
AIzaSyAYiBZKx7MnpbEhh9jyipgxe19OcubqV5w
April 1, 2024
187355
Malawi
MWI
true
2
1
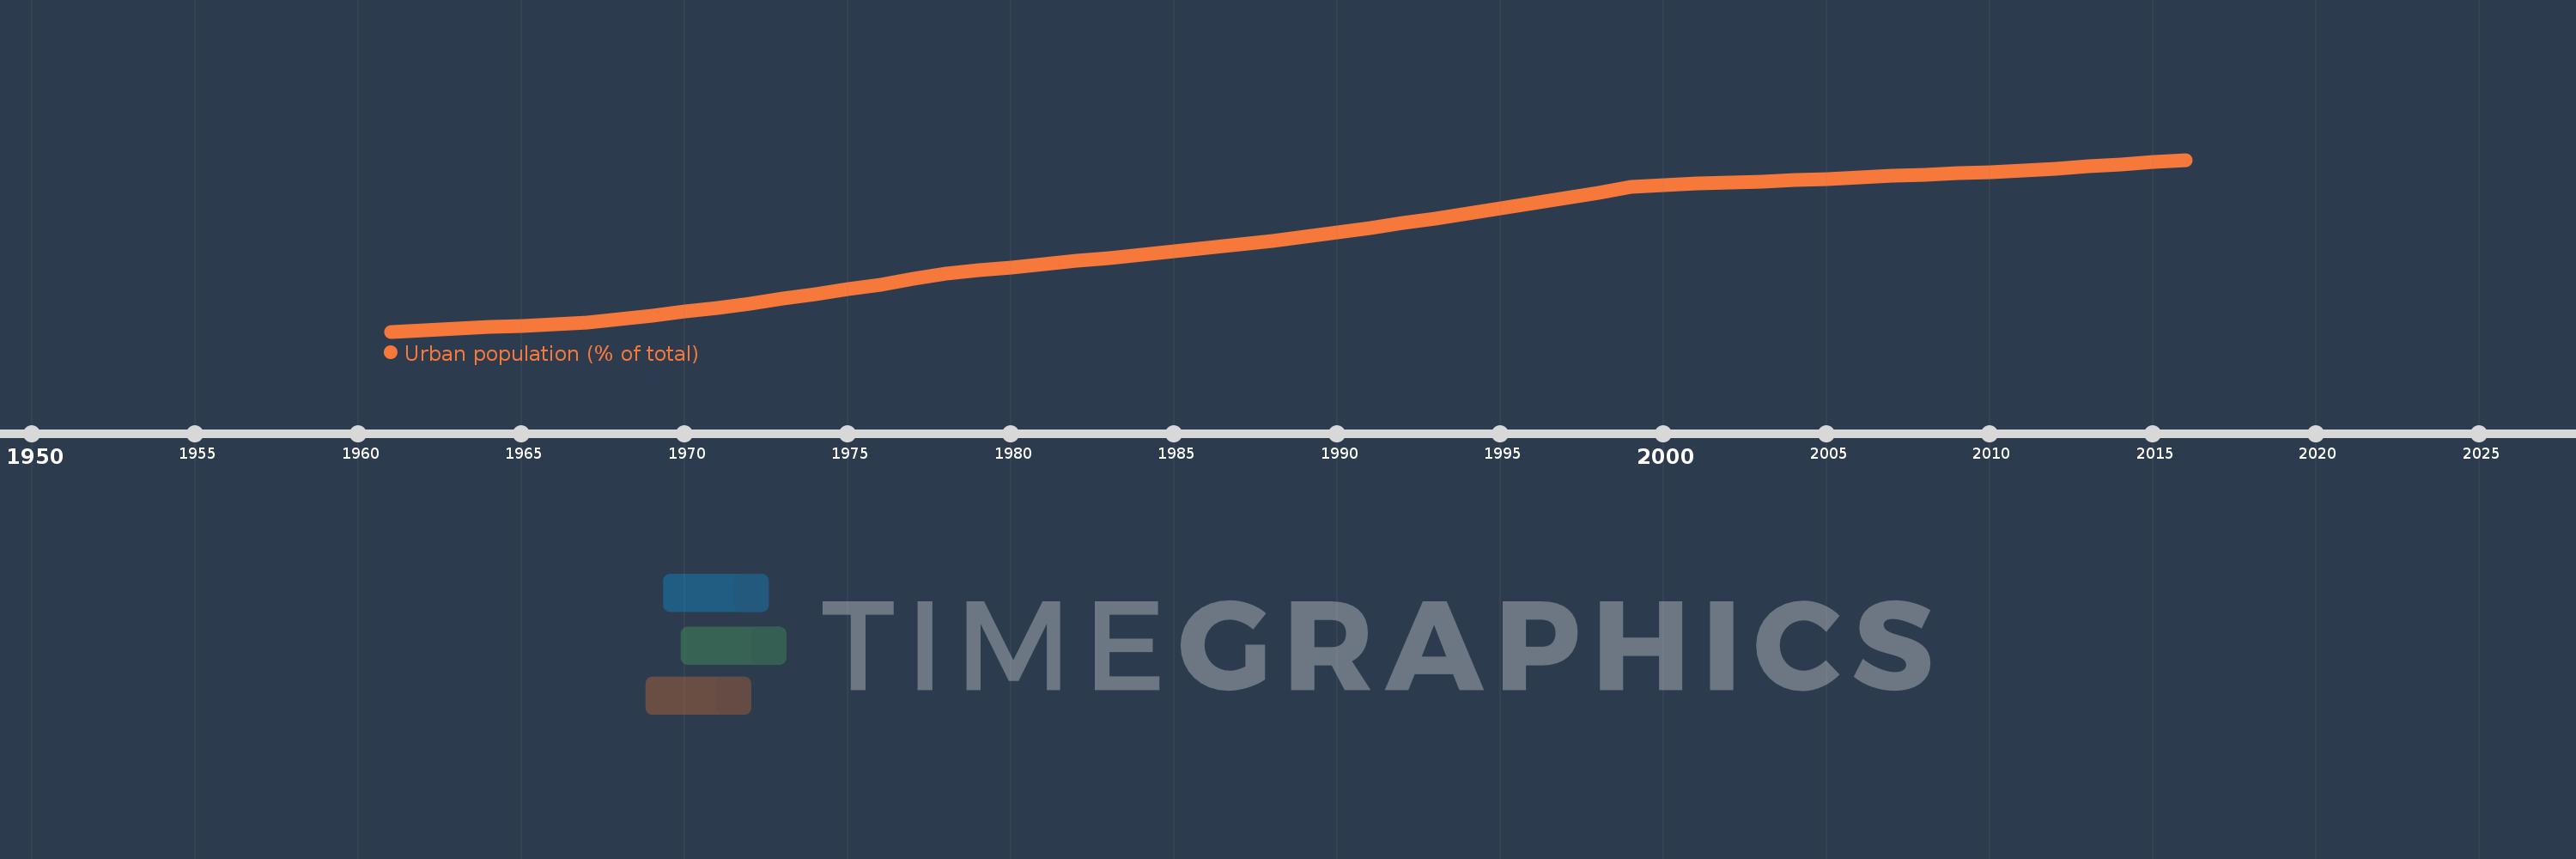
Urban population (% of total)
2016,2015,2014,2013,2012,2011,2010,2009,2008,2007,2006,2005,2004,2003,2002,2001,2000,1999,1998,1997,1996,1995,1994,1993,1992,1991,1990,1989,1988,1987,1986,1985,1984,1983,1982,1981,1980,1979,1978,1977,1976,1975,1974,1973,1972,1971,1970,1969,1968,1967,1966,1965,1964,1963,1962,1961
This statistics in other country:
AfghanistanAlbaniaAlgeriaAmerican SamoaAndorraAngolaAntigua and BarbudaArab WorldArgentinaArmeniaArubaAustraliaAustriaAzerbaijanBahamas, TheBahrainBangladeshBarbadosBelarusBelgiumBelizeBeninBermudaBhutanBoliviaBosnia and HerzegovinaBotswanaBrazilBritish Virgin IslandsBrunei DarussalamBulgariaBurkina FasoBurundiCabo VerdeCambodiaCameroonCanadaCaribbean small statesCayman IslandsCentral African RepublicCentral Europe and the BalticsChadChannel IslandsChileChinaColombiaComorosCongo, Dem. Rep.Congo, Rep.Costa RicaCote d'IvoireCroatiaCubaCuracaoCyprusCzech RepublicDenmarkDjiboutiDominicaDominican RepublicEarly-demographic dividendEast Asia & PacificEast Asia & Pacific (excluding high income)East Asia & Pacific (IDA & IBRD countries)EcuadorEgypt, Arab Rep.El SalvadorEquatorial GuineaEritreaEstoniaEthiopiaEuro areaEurope & Central AsiaEurope & Central Asia (excluding high income)Europe & Central Asia (IDA & IBRD countries)European UnionFaroe IslandsFijiFinlandFragile and conflict affected situationsFranceFrench PolynesiaGabonGambia, TheGeorgiaGermanyGhanaGibraltarGreeceGreenlandGrenadaGuamGuatemalaGuineaGuinea-BissauGuyanaHaitiHeavily indebted poor countries (HIPC)High incomeHondurasHong Kong SAR, ChinaHungaryIBRD onlyIcelandIDA & IBRD totalIDA blendIDA onlyIDA totalIndiaIndonesiaIran, Islamic Rep.IraqIrelandIsle of ManIsraelItalyJamaicaJapanJordanKazakhstanKenyaKiribatiKorea, Dem. People’s Rep.Korea, Rep.KuwaitKyrgyz RepublicLao PDRLate-demographic dividendLatin America & Caribbean Latin America & Caribbean (excluding high income)Latin America & the Caribbean (IDA & IBRD countries)LatviaLeast developed countries: UN classificationLebanonLesothoLiberiaLibyaLiechtensteinLithuaniaLow & middle incomeLow incomeLower middle incomeLuxembourgMacao SAR, ChinaMacedonia, FYRMadagascarMalawiMalaysiaMaldivesMaliMaltaMarshall IslandsMauritaniaMauritiusMexicoMicronesia, Fed. Sts.Middle East & North AfricaMiddle East & North Africa (excluding high income)Middle East & North Africa (IDA & IBRD countries)Middle incomeMoldovaMonacoMongoliaMontenegroMoroccoMozambiqueMyanmarNamibiaNauruNepalNetherlandsNew CaledoniaNew ZealandNicaraguaNigerNigeriaNorth AmericaNorthern Mariana IslandsNorwayOECD membersOmanOther small statesPacific island small statesPakistanPalauPanamaPapua New GuineaParaguayPeruPhilippinesPolandPortugalPost-demographic dividendPre-demographic dividendPuerto RicoQatarRomaniaRussian FederationRwandaSamoaSan MarinoSao Tome and PrincipeSaudi ArabiaSenegalSerbiaSeychellesSierra LeoneSingaporeSint Maarten (Dutch part)Slovak RepublicSloveniaSmall statesSolomon IslandsSomaliaSouth AfricaSouth AsiaSouth Asia (IDA & IBRD)South SudanSpainSri LankaSt. Kitts and NevisSt. LuciaSt. Vincent and the GrenadinesSub-Saharan Africa Sub-Saharan Africa (excluding high income)Sub-Saharan Africa (IDA & IBRD countries)SudanSurinameSwazilandSwedenSwitzerlandSyrian Arab RepublicTajikistanTanzaniaThailandTimor-LesteTogoTongaTrinidad and TobagoTunisiaTurkeyTurkmenistanTurks and Caicos IslandsTuvaluUgandaUkraineUnited Arab EmiratesUnited KingdomUnited StatesUpper middle incomeUruguayUzbekistanVanuatuVenezuela, RBVietnamVirgin Islands (U.S.)West Bank and GazaWorldYemen, Rep.ZambiaZimbabwe Timeline:
This timeline shows a graph from 1961 to 2016 of Malawi. No data until 1960. Number of actual observations by date: 56.
Source name:
World Development Indicators
Source organization:
United Nations, World Urbanization Prospects.
Categories, topics:
Climate Change, Urban Development
Last updated:
apr 23, 2017
Indicators value changes by year
Maximum:
16.272
jan 1, 2016
At the date of observation
Value
Absolute change
Change from previous value
jan 1, 1961
4.39
+4.39
0.0%
jan 1, 1962
4.489
+0.099
2.26%
jan 1, 1963
4.59
+0.101
2.25%
jan 1, 1964
4.694
+0.104
2.27%
jan 1, 1965
4.8
+0.106
2.26%
jan 1, 1966
4.908
+0.108
2.25%
jan 1, 1967
5.018
+0.11
2.24%
jan 1, 1968
5.249
+0.231
4.6%
jan 1, 1969
5.505
+0.256
4.88%
jan 1, 1970
5.773
+0.268
4.87%
jan 1, 1971
6.053
+0.28
4.85%
jan 1, 1972
6.345
+0.292
4.82%
jan 1, 1973
6.651
+0.306
4.82%
jan 1, 1974
6.97
+0.319
4.8%
jan 1, 1975
7.304
+0.334
4.79%
jan 1, 1976
7.652
+0.348
4.76%
jan 1, 1977
8.015
+0.363
4.74%
jan 1, 1978
8.394
+0.379
4.73%
jan 1, 1979
8.636
+0.242
2.88%
jan 1, 1980
8.841
+0.205
2.37%
jan 1, 1981
9.05
+0.209
2.36%
jan 1, 1982
9.263
+0.213
2.35%
jan 1, 1983
9.481
+0.218
2.35%
jan 1, 1984
9.704
+0.223
2.35%
jan 1, 1985
9.931
+0.227
2.34%
jan 1, 1986
10.163
+0.232
2.34%
jan 1, 1987
10.4
+0.237
2.33%
jan 1, 1988
10.641
+0.241
2.32%
jan 1, 1989
10.934
+0.293
2.75%
jan 1, 1990
11.243
+0.309
2.83%
jan 1, 1991
11.56
+0.317
2.82%
jan 1, 1992
11.885
+0.325
2.81%
jan 1, 1993
12.218
+0.333
2.8%
jan 1, 1994
12.558
+0.34
2.78%
jan 1, 1995
12.907
+0.349
2.78%
jan 1, 1996
13.263
+0.356
2.76%
jan 1, 1997
13.629
+0.366
2.76%
jan 1, 1998
14.002
+0.373
2.74%
jan 1, 1999
14.384
+0.382
2.73%
jan 1, 2000
14.522
+0.138
0.96%
jan 1, 2001
14.61
+0.088
0.61%
jan 1, 2002
14.698
+0.088
0.6%
jan 1, 2003
14.786
+0.088
0.6%
jan 1, 2004
14.875
+0.089
0.6%
jan 1, 2005
14.964
+0.089
0.6%
jan 1, 2006
15.054
+0.09
0.6%
jan 1, 2007
15.144
+0.09
0.6%
jan 1, 2008
15.235
+0.091
0.6%
jan 1, 2009
15.326
+0.091
0.6%
jan 1, 2010
15.427
+0.101
0.66%
jan 1, 2011
15.54
+0.113
0.73%
jan 1, 2012
15.663
+0.123
0.79%
jan 1, 2013
15.798
+0.135
0.86%
jan 1, 2014
15.944
+0.146
0.92%
jan 1, 2015
16.102
+0.158
0.99%
jan 1, 2016
16.272
+0.17
1.06%
Ranking of countries by current statistics by years


Comments: