29
/
en
AIzaSyAYiBZKx7MnpbEhh9jyipgxe19OcubqV5w
April 1, 2024
234300
Sao Tome and Principe
STP
true
2
1
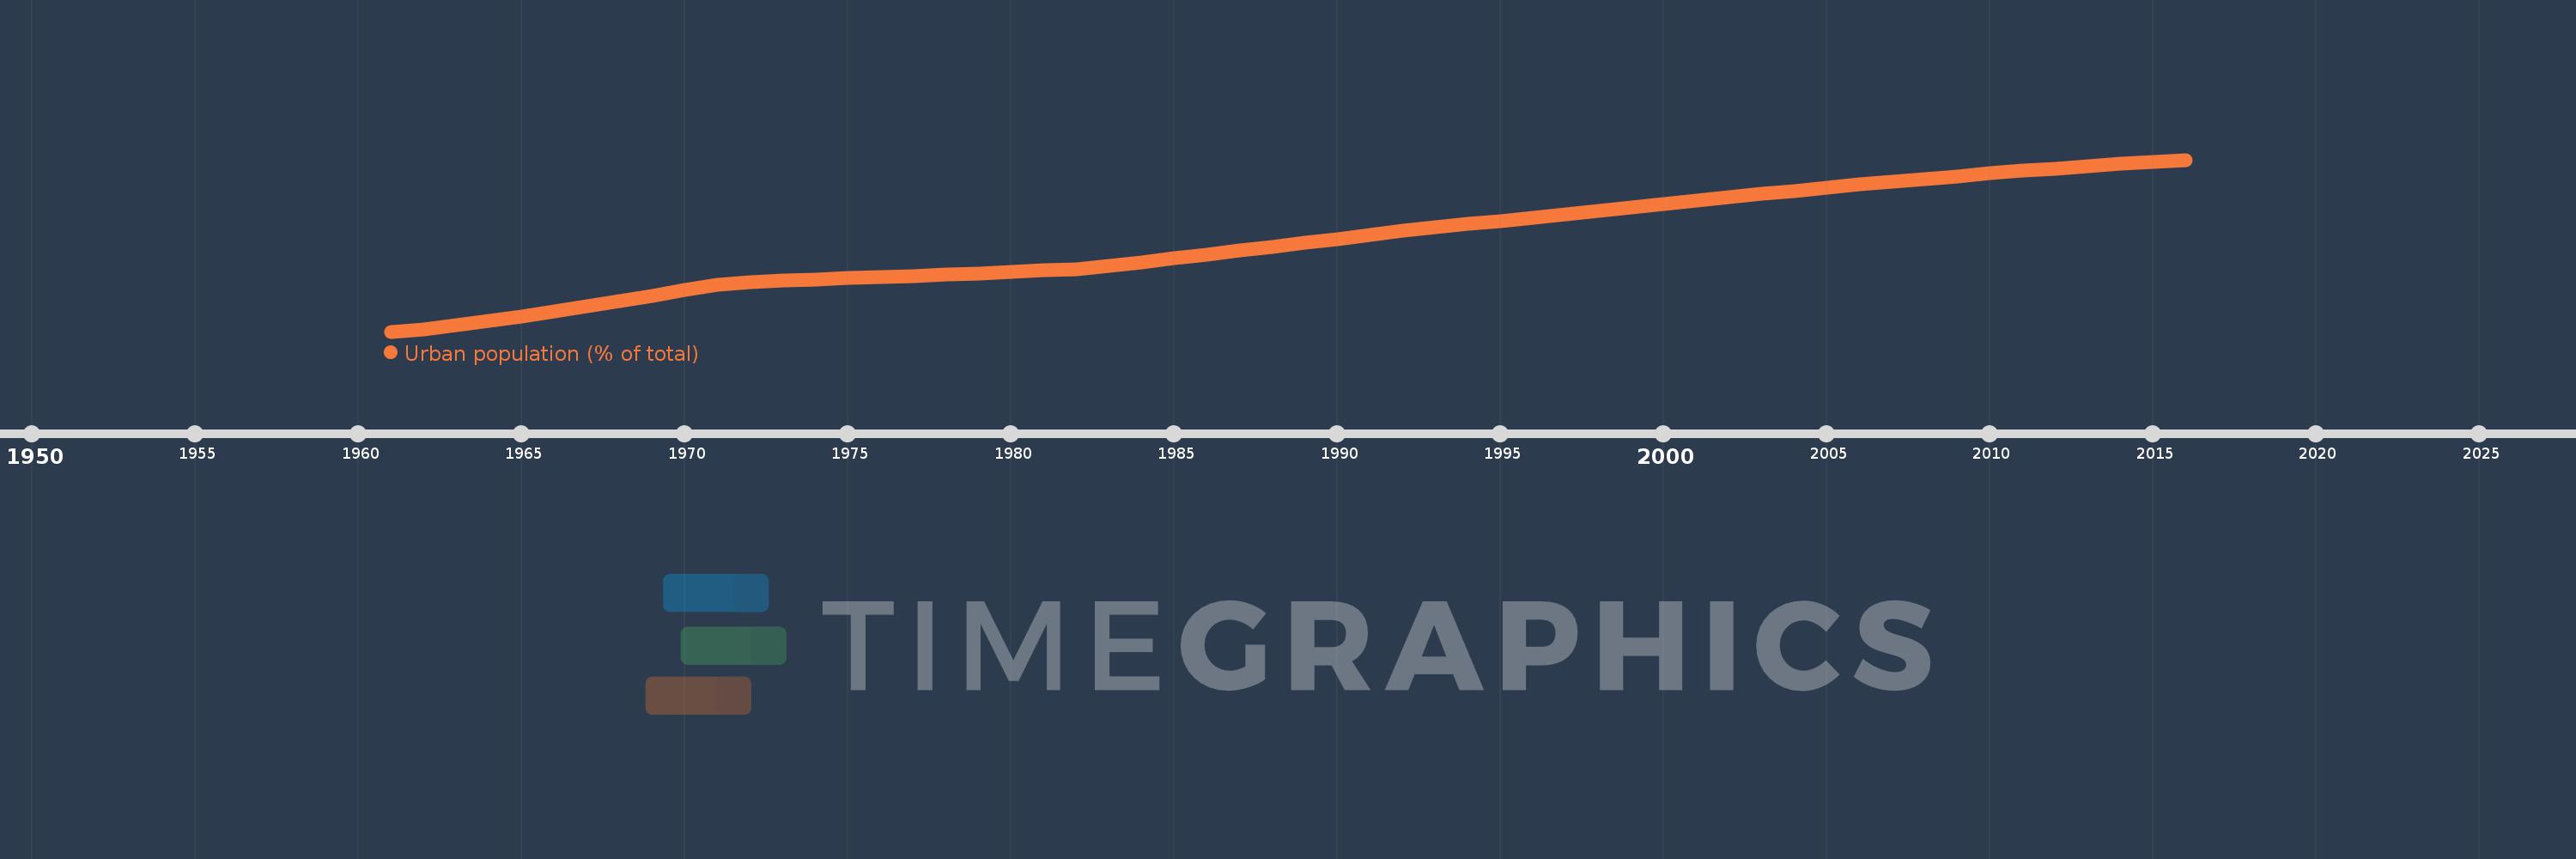
Urban population (% of total)
2016,2015,2014,2013,2012,2011,2010,2009,2008,2007,2006,2005,2004,2003,2002,2001,2000,1999,1998,1997,1996,1995,1994,1993,1992,1991,1990,1989,1988,1987,1986,1985,1984,1983,1982,1981,1980,1979,1978,1977,1976,1975,1974,1973,1972,1971,1970,1969,1968,1967,1966,1965,1964,1963,1962,1961
This statistics in other country:
AfghanistanAlbaniaAlgeriaAmerican SamoaAndorraAngolaAntigua and BarbudaArab WorldArgentinaArmeniaArubaAustraliaAustriaAzerbaijanBahamas, TheBahrainBangladeshBarbadosBelarusBelgiumBelizeBeninBermudaBhutanBoliviaBosnia and HerzegovinaBotswanaBrazilBritish Virgin IslandsBrunei DarussalamBulgariaBurkina FasoBurundiCabo VerdeCambodiaCameroonCanadaCaribbean small statesCayman IslandsCentral African RepublicCentral Europe and the BalticsChadChannel IslandsChileChinaColombiaComorosCongo, Dem. Rep.Congo, Rep.Costa RicaCote d'IvoireCroatiaCubaCuracaoCyprusCzech RepublicDenmarkDjiboutiDominicaDominican RepublicEarly-demographic dividendEast Asia & PacificEast Asia & Pacific (excluding high income)East Asia & Pacific (IDA & IBRD countries)EcuadorEgypt, Arab Rep.El SalvadorEquatorial GuineaEritreaEstoniaEthiopiaEuro areaEurope & Central AsiaEurope & Central Asia (excluding high income)Europe & Central Asia (IDA & IBRD countries)European UnionFaroe IslandsFijiFinlandFragile and conflict affected situationsFranceFrench PolynesiaGabonGambia, TheGeorgiaGermanyGhanaGibraltarGreeceGreenlandGrenadaGuamGuatemalaGuineaGuinea-BissauGuyanaHaitiHeavily indebted poor countries (HIPC)High incomeHondurasHong Kong SAR, ChinaHungaryIBRD onlyIcelandIDA & IBRD totalIDA blendIDA onlyIDA totalIndiaIndonesiaIran, Islamic Rep.IraqIrelandIsle of ManIsraelItalyJamaicaJapanJordanKazakhstanKenyaKiribatiKorea, Dem. People’s Rep.Korea, Rep.KuwaitKyrgyz RepublicLao PDRLate-demographic dividendLatin America & Caribbean Latin America & Caribbean (excluding high income)Latin America & the Caribbean (IDA & IBRD countries)LatviaLeast developed countries: UN classificationLebanonLesothoLiberiaLibyaLiechtensteinLithuaniaLow & middle incomeLow incomeLower middle incomeLuxembourgMacao SAR, ChinaMacedonia, FYRMadagascarMalawiMalaysiaMaldivesMaliMaltaMarshall IslandsMauritaniaMauritiusMexicoMicronesia, Fed. Sts.Middle East & North AfricaMiddle East & North Africa (excluding high income)Middle East & North Africa (IDA & IBRD countries)Middle incomeMoldovaMonacoMongoliaMontenegroMoroccoMozambiqueMyanmarNamibiaNauruNepalNetherlandsNew CaledoniaNew ZealandNicaraguaNigerNigeriaNorth AmericaNorthern Mariana IslandsNorwayOECD membersOmanOther small statesPacific island small statesPakistanPalauPanamaPapua New GuineaParaguayPeruPhilippinesPolandPortugalPost-demographic dividendPre-demographic dividendPuerto RicoQatarRomaniaRussian FederationRwandaSamoaSan MarinoSao Tome and PrincipeSaudi ArabiaSenegalSerbiaSeychellesSierra LeoneSingaporeSint Maarten (Dutch part)Slovak RepublicSloveniaSmall statesSolomon IslandsSomaliaSouth AfricaSouth AsiaSouth Asia (IDA & IBRD)South SudanSpainSri LankaSt. Kitts and NevisSt. LuciaSt. Vincent and the GrenadinesSub-Saharan Africa Sub-Saharan Africa (excluding high income)Sub-Saharan Africa (IDA & IBRD countries)SudanSurinameSwazilandSwedenSwitzerlandSyrian Arab RepublicTajikistanTanzaniaThailandTimor-LesteTogoTongaTrinidad and TobagoTunisiaTurkeyTurkmenistanTurks and Caicos IslandsTuvaluUgandaUkraineUnited Arab EmiratesUnited KingdomUnited StatesUpper middle incomeUruguayUzbekistanVanuatuVenezuela, RBVietnamVirgin Islands (U.S.)West Bank and GazaWorldYemen, Rep.ZambiaZimbabwe Timeline:
This timeline shows a graph from 1961 to 2016 of Sao Tome and Principe. No data until 1960. Number of actual observations by date: 56.
Source name:
World Development Indicators
Source organization:
United Nations, World Urbanization Prospects.
Categories, topics:
Climate Change, Urban Development
Last updated:
apr 23, 2017
Indicators value changes by year
Minimum:
16.073
jan 1, 1961
Maximum:
65.092
jan 1, 2016
At the date of observation
Value
Absolute change
Change from previous value
jan 1, 1961
16.073
+16.073
0.0%
jan 1, 1962
16.805
+0.732
4.55%
jan 1, 1963
17.969
+1.164
6.93%
jan 1, 1964
19.194
+1.225
6.82%
jan 1, 1965
20.484
+1.29
6.72%
jan 1, 1966
21.833
+1.349
6.59%
jan 1, 1967
23.247
+1.414
6.48%
jan 1, 1968
24.724
+1.477
6.35%
jan 1, 1969
26.264
+1.54
6.23%
jan 1, 1970
27.861
+1.597
6.08%
jan 1, 1971
29.518
+1.657
5.95%
jan 1, 1972
30.205
+0.687
2.33%
jan 1, 1973
30.561
+0.356
1.18%
jan 1, 1974
30.917
+0.356
1.16%
jan 1, 1975
31.277
+0.36
1.16%
jan 1, 1976
31.639
+0.362
1.16%
jan 1, 1977
32.004
+0.365
1.15%
jan 1, 1978
32.37
+0.366
1.14%
jan 1, 1979
32.738
+0.368
1.14%
jan 1, 1980
33.109
+0.371
1.13%
jan 1, 1981
33.482
+0.373
1.13%
jan 1, 1982
33.857
+0.375
1.12%
jan 1, 1983
34.826
+0.969
2.86%
jan 1, 1984
35.887
+1.061
3.05%
jan 1, 1985
36.963
+1.076
3.0%
jan 1, 1986
38.049
+1.086
2.94%
jan 1, 1987
39.149
+1.1
2.89%
jan 1, 1988
40.26
+1.111
2.84%
jan 1, 1989
41.382
+1.122
2.79%
jan 1, 1990
42.511
+1.129
2.73%
jan 1, 1991
43.648
+1.137
2.67%
jan 1, 1992
44.793
+1.145
2.62%
jan 1, 1993
45.764
+0.971
2.17%
jan 1, 1994
46.717
+0.953
2.08%
jan 1, 1995
47.673
+0.956
2.05%
jan 1, 1996
48.631
+0.958
2.01%
jan 1, 1997
49.592
+0.961
1.98%
jan 1, 1998
50.55
+0.958
1.93%
jan 1, 1999
51.509
+0.959
1.9%
jan 1, 2000
52.467
+0.958
1.86%
jan 1, 2001
53.424
+0.957
1.82%
jan 1, 2002
54.377
+0.953
1.78%
jan 1, 2003
55.327
+0.95
1.75%
jan 1, 2004
56.25
+0.923
1.67%
jan 1, 2005
57.144
+0.894
1.59%
jan 1, 2006
58.01
+0.866
1.52%
jan 1, 2007
58.847
+0.837
1.44%
jan 1, 2008
59.655
+0.808
1.37%
jan 1, 2009
60.434
+0.779
1.31%
jan 1, 2010
61.185
+0.751
1.24%
jan 1, 2011
61.907
+0.722
1.18%
jan 1, 2012
62.6
+0.693
1.12%
jan 1, 2013
63.265
+0.665
1.06%
jan 1, 2014
63.902
+0.637
1.01%
jan 1, 2015
64.511
+0.609
0.95%
jan 1, 2016
65.092
+0.581
0.9%
Ranking of countries by current statistics by years


Comments: