29
/
en
AIzaSyAYiBZKx7MnpbEhh9jyipgxe19OcubqV5w
April 1, 2024
238858
Seychelles
SYC
true
2
1
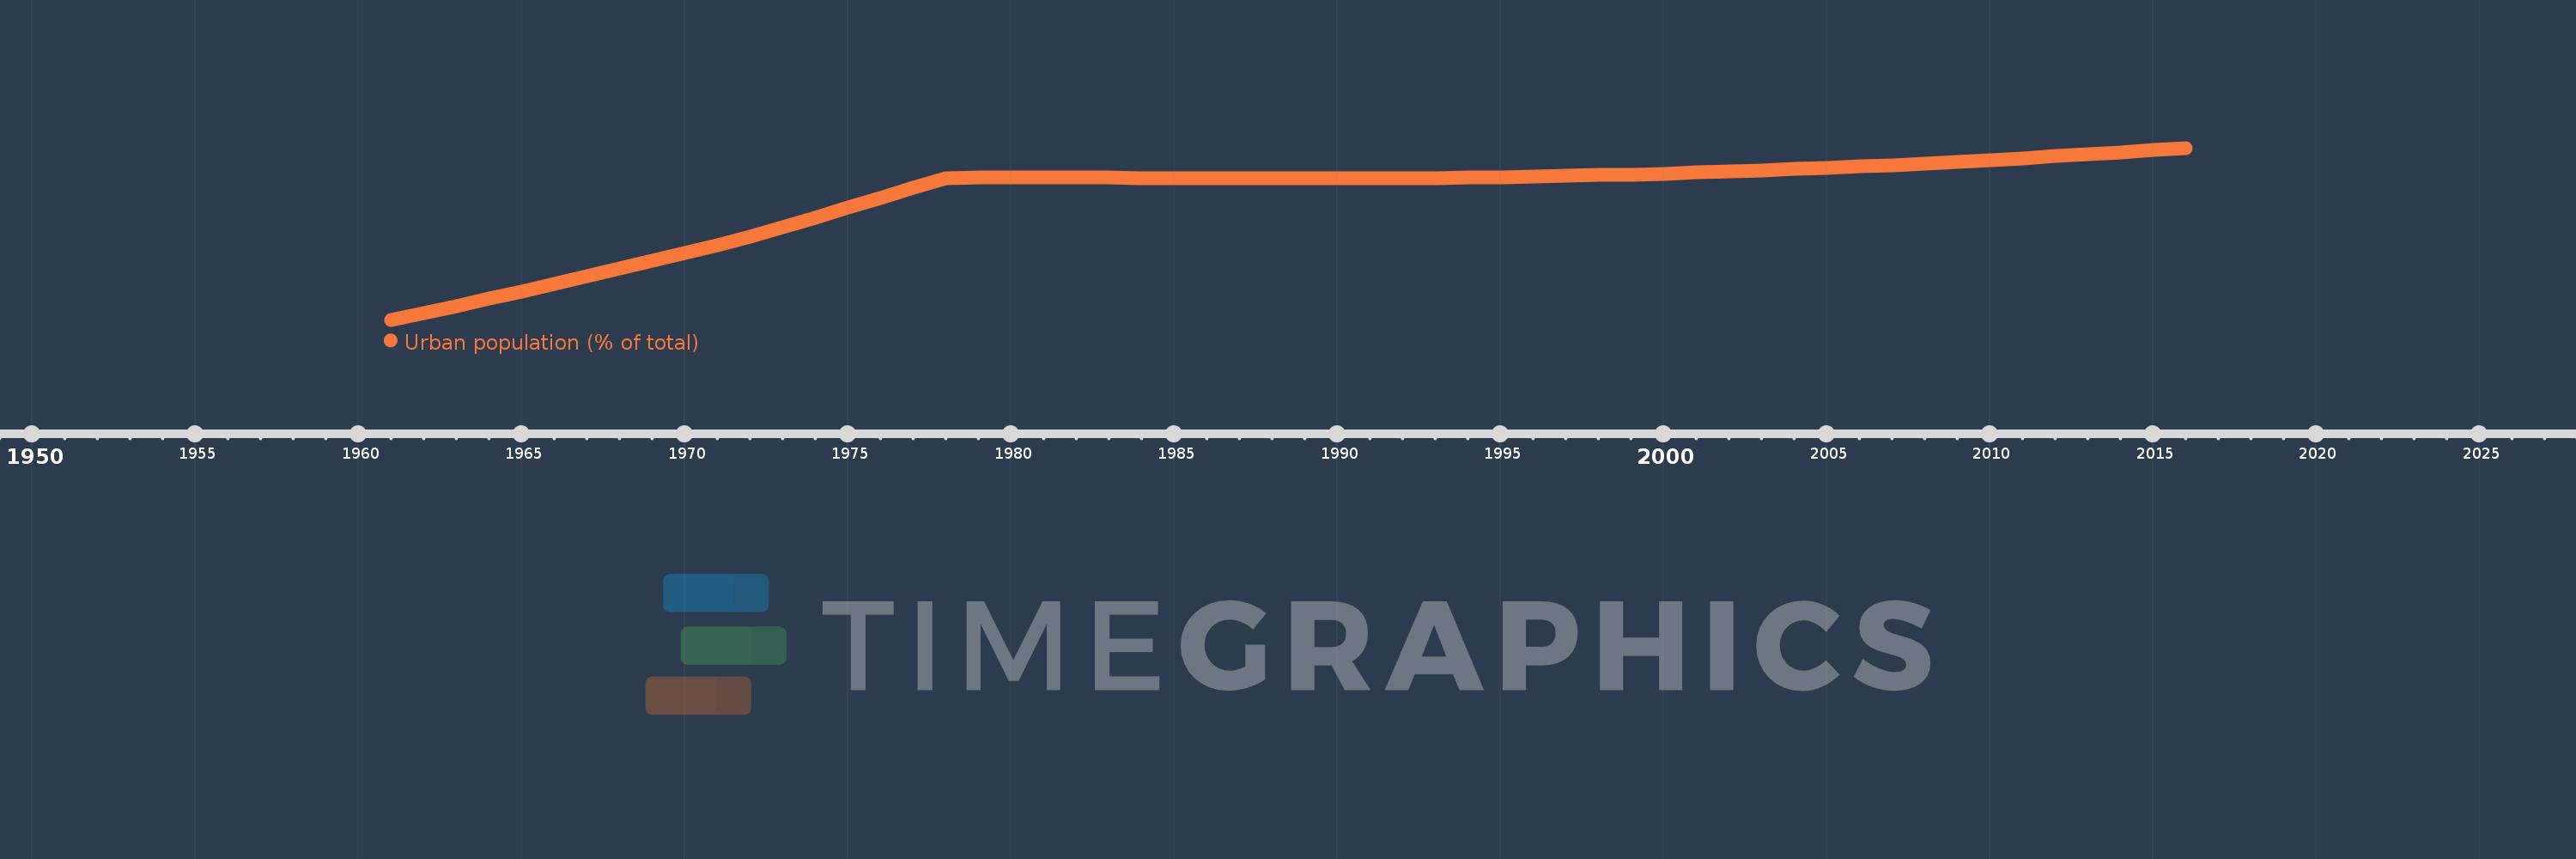
Urban population (% of total)
2016,2015,2014,2013,2012,2011,2010,2009,2008,2007,2006,2005,2004,2003,2002,2001,2000,1999,1998,1997,1996,1995,1994,1993,1992,1991,1990,1989,1988,1987,1986,1985,1984,1983,1982,1981,1980,1979,1978,1977,1976,1975,1974,1973,1972,1971,1970,1969,1968,1967,1966,1965,1964,1963,1962,1961
This statistics in other country:
AfghanistanAlbaniaAlgeriaAmerican SamoaAndorraAngolaAntigua and BarbudaArab WorldArgentinaArmeniaArubaAustraliaAustriaAzerbaijanBahamas, TheBahrainBangladeshBarbadosBelarusBelgiumBelizeBeninBermudaBhutanBoliviaBosnia and HerzegovinaBotswanaBrazilBritish Virgin IslandsBrunei DarussalamBulgariaBurkina FasoBurundiCabo VerdeCambodiaCameroonCanadaCaribbean small statesCayman IslandsCentral African RepublicCentral Europe and the BalticsChadChannel IslandsChileChinaColombiaComorosCongo, Dem. Rep.Congo, Rep.Costa RicaCote d'IvoireCroatiaCubaCuracaoCyprusCzech RepublicDenmarkDjiboutiDominicaDominican RepublicEarly-demographic dividendEast Asia & PacificEast Asia & Pacific (excluding high income)East Asia & Pacific (IDA & IBRD countries)EcuadorEgypt, Arab Rep.El SalvadorEquatorial GuineaEritreaEstoniaEthiopiaEuro areaEurope & Central AsiaEurope & Central Asia (excluding high income)Europe & Central Asia (IDA & IBRD countries)European UnionFaroe IslandsFijiFinlandFragile and conflict affected situationsFranceFrench PolynesiaGabonGambia, TheGeorgiaGermanyGhanaGibraltarGreeceGreenlandGrenadaGuamGuatemalaGuineaGuinea-BissauGuyanaHaitiHeavily indebted poor countries (HIPC)High incomeHondurasHong Kong SAR, ChinaHungaryIBRD onlyIcelandIDA & IBRD totalIDA blendIDA onlyIDA totalIndiaIndonesiaIran, Islamic Rep.IraqIrelandIsle of ManIsraelItalyJamaicaJapanJordanKazakhstanKenyaKiribatiKorea, Dem. People’s Rep.Korea, Rep.KuwaitKyrgyz RepublicLao PDRLate-demographic dividendLatin America & Caribbean Latin America & Caribbean (excluding high income)Latin America & the Caribbean (IDA & IBRD countries)LatviaLeast developed countries: UN classificationLebanonLesothoLiberiaLibyaLiechtensteinLithuaniaLow & middle incomeLow incomeLower middle incomeLuxembourgMacao SAR, ChinaMacedonia, FYRMadagascarMalawiMalaysiaMaldivesMaliMaltaMarshall IslandsMauritaniaMauritiusMexicoMicronesia, Fed. Sts.Middle East & North AfricaMiddle East & North Africa (excluding high income)Middle East & North Africa (IDA & IBRD countries)Middle incomeMoldovaMonacoMongoliaMontenegroMoroccoMozambiqueMyanmarNamibiaNauruNepalNetherlandsNew CaledoniaNew ZealandNicaraguaNigerNigeriaNorth AmericaNorthern Mariana IslandsNorwayOECD membersOmanOther small statesPacific island small statesPakistanPalauPanamaPapua New GuineaParaguayPeruPhilippinesPolandPortugalPost-demographic dividendPre-demographic dividendPuerto RicoQatarRomaniaRussian FederationRwandaSamoaSan MarinoSao Tome and PrincipeSaudi ArabiaSenegalSerbiaSeychellesSierra LeoneSingaporeSint Maarten (Dutch part)Slovak RepublicSloveniaSmall statesSolomon IslandsSomaliaSouth AfricaSouth AsiaSouth Asia (IDA & IBRD)South SudanSpainSri LankaSt. Kitts and NevisSt. LuciaSt. Vincent and the GrenadinesSub-Saharan Africa Sub-Saharan Africa (excluding high income)Sub-Saharan Africa (IDA & IBRD countries)SudanSurinameSwazilandSwedenSwitzerlandSyrian Arab RepublicTajikistanTanzaniaThailandTimor-LesteTogoTongaTrinidad and TobagoTunisiaTurkeyTurkmenistanTurks and Caicos IslandsTuvaluUgandaUkraineUnited Arab EmiratesUnited KingdomUnited StatesUpper middle incomeUruguayUzbekistanVanuatuVenezuela, RBVietnamVirgin Islands (U.S.)West Bank and GazaWorldYemen, Rep.ZambiaZimbabwe Timeline:
This timeline shows a graph from 1961 to 2016 of Seychelles. No data until 1960. Number of actual observations by date: 56.
Source name:
World Development Indicators
Source organization:
United Nations, World Urbanization Prospects.
Categories, topics:
Climate Change, Urban Development
Last updated:
apr 23, 2017
Indicators value changes by year
Minimum:
27.673
jan 1, 1961
Maximum:
53.887
jan 1, 2016
At the date of observation
Value
Absolute change
Change from previous value
jan 1, 1961
27.673
+27.673
0.0%
jan 1, 1962
28.717
+1.044
3.77%
jan 1, 1963
29.786
+1.069
3.72%
jan 1, 1964
30.877
+1.091
3.66%
jan 1, 1965
31.991
+1.114
3.61%
jan 1, 1966
33.123
+1.132
3.54%
jan 1, 1967
34.277
+1.154
3.48%
jan 1, 1968
35.449
+1.172
3.42%
jan 1, 1969
36.641
+1.192
3.36%
jan 1, 1970
37.846
+1.205
3.29%
jan 1, 1971
39.068
+1.222
3.23%
jan 1, 1972
40.337
+1.269
3.25%
jan 1, 1973
41.802
+1.465
3.63%
jan 1, 1974
43.277
+1.475
3.53%
jan 1, 1975
44.767
+1.49
3.44%
jan 1, 1976
46.266
+1.499
3.35%
jan 1, 1977
47.774
+1.508
3.26%
jan 1, 1978
49.282
+1.508
3.16%
jan 1, 1979
49.396
+0.114
0.23%
jan 1, 1980
49.381
-0.015
-0.03%
jan 1, 1981
49.366
-0.015
-0.03%
jan 1, 1982
49.352
-0.014
-0.03%
jan 1, 1983
49.337
-0.015
-0.03%
jan 1, 1984
49.322
-0.015
-0.03%
jan 1, 1985
49.307
-0.015
-0.03%
jan 1, 1986
49.292
-0.015
-0.03%
jan 1, 1987
49.277
-0.015
-0.03%
jan 1, 1988
49.262
-0.015
-0.03%
jan 1, 1989
49.247
-0.015
-0.03%
jan 1, 1990
49.246
-0.001
0.0%
jan 1, 1991
49.258
+0.012
0.02%
jan 1, 1992
49.283
+0.025
0.05%
jan 1, 1993
49.322
+0.039
0.08%
jan 1, 1994
49.375
+0.053
0.11%
jan 1, 1995
49.441
+0.066
0.13%
jan 1, 1996
49.52
+0.079
0.16%
jan 1, 1997
49.613
+0.093
0.19%
jan 1, 1998
49.72
+0.107
0.22%
jan 1, 1999
49.84
+0.12
0.24%
jan 1, 2000
49.973
+0.133
0.27%
jan 1, 2001
50.12
+0.147
0.29%
jan 1, 2002
50.28
+0.16
0.32%
jan 1, 2003
50.454
+0.174
0.35%
jan 1, 2004
50.641
+0.187
0.37%
jan 1, 2005
50.841
+0.2
0.39%
jan 1, 2006
51.055
+0.214
0.42%
jan 1, 2007
51.282
+0.227
0.44%
jan 1, 2008
51.522
+0.24
0.47%
jan 1, 2009
51.775
+0.253
0.49%
jan 1, 2010
52.041
+0.266
0.51%
jan 1, 2011
52.319
+0.278
0.53%
jan 1, 2012
52.611
+0.292
0.56%
jan 1, 2013
52.915
+0.304
0.58%
jan 1, 2014
53.231
+0.316
0.6%
jan 1, 2015
53.559
+0.328
0.62%
jan 1, 2016
53.887
+0.328
0.61%
Ranking of countries by current statistics by years


Comments: