29
/
en
AIzaSyAYiBZKx7MnpbEhh9jyipgxe19OcubqV5w
April 1, 2024
273101
Uganda
UGA
true
2
1
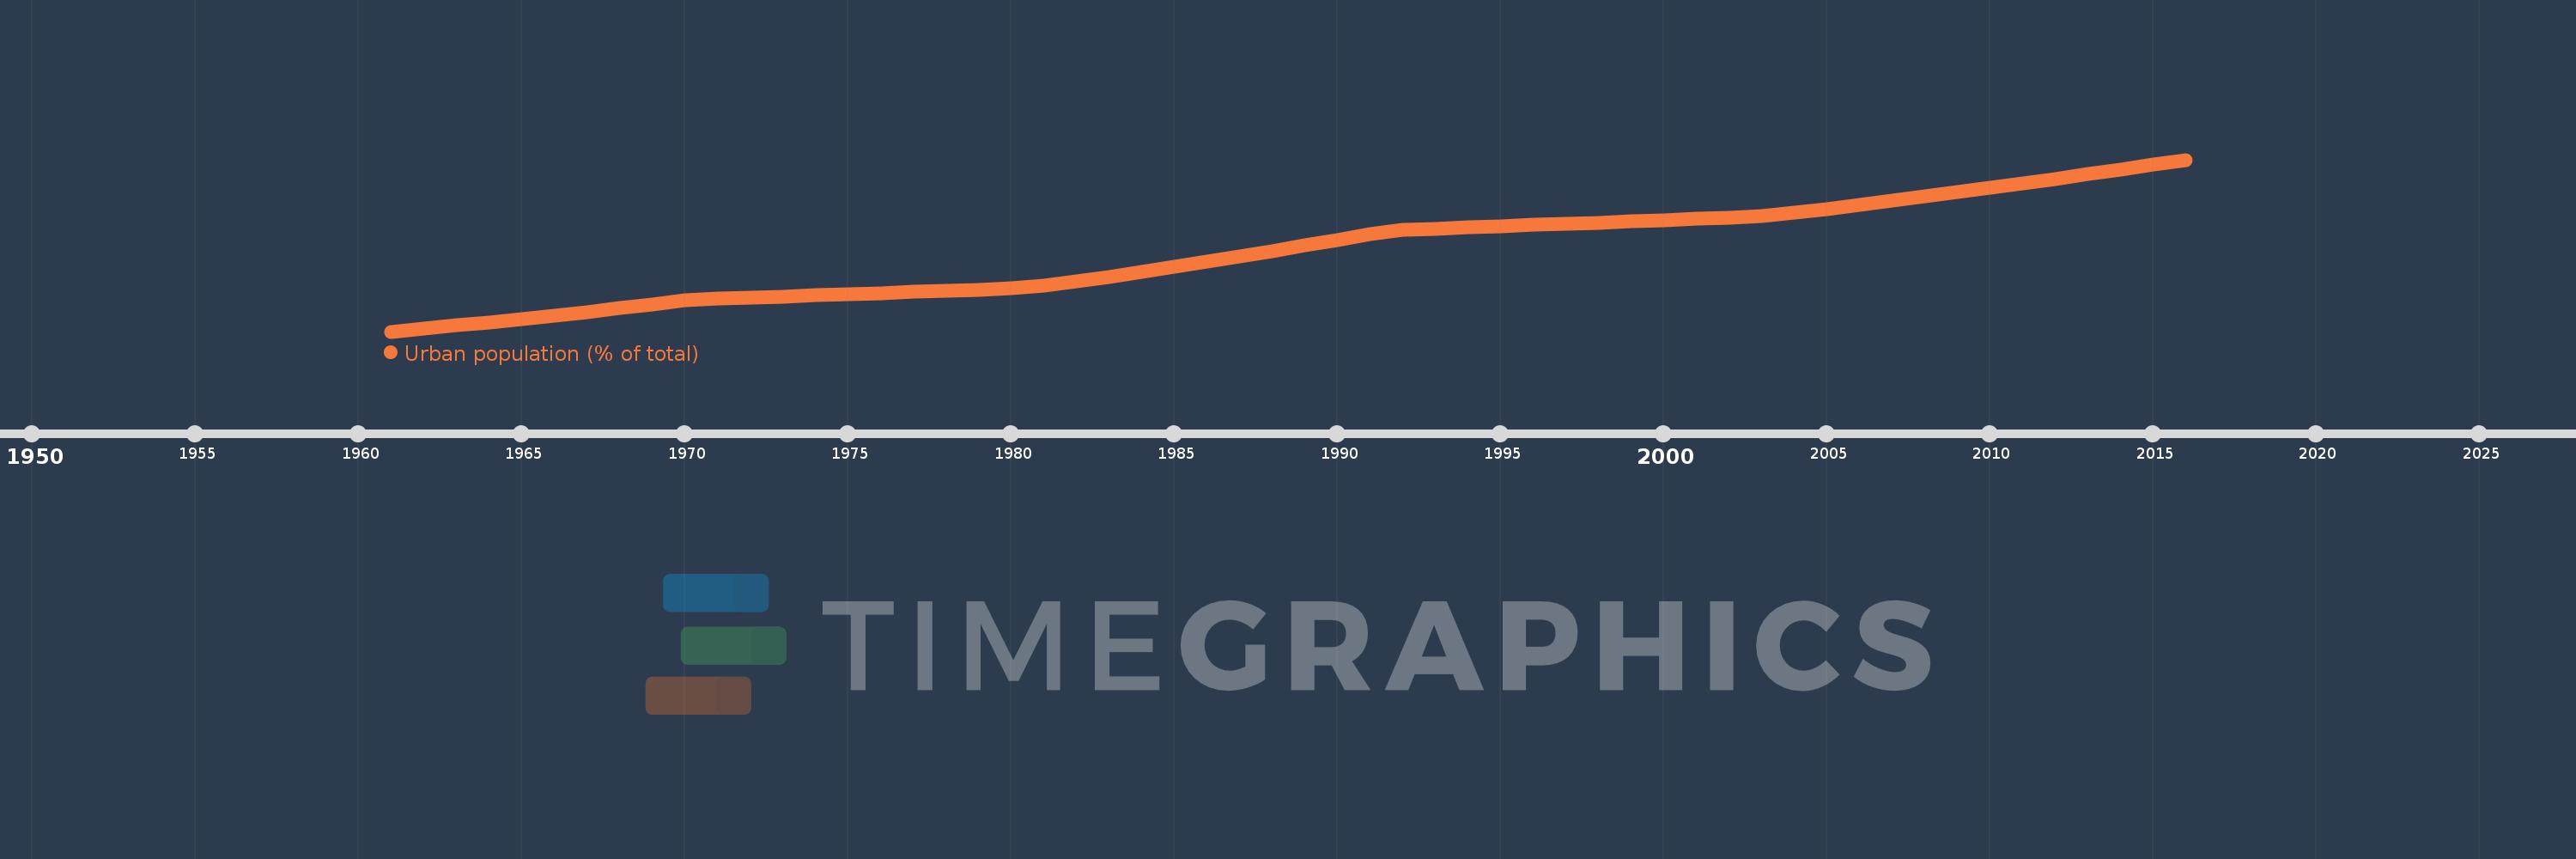
Urban population (% of total)
2016,2015,2014,2013,2012,2011,2010,2009,2008,2007,2006,2005,2004,2003,2002,2001,2000,1999,1998,1997,1996,1995,1994,1993,1992,1991,1990,1989,1988,1987,1986,1985,1984,1983,1982,1981,1980,1979,1978,1977,1976,1975,1974,1973,1972,1971,1970,1969,1968,1967,1966,1965,1964,1963,1962,1961
This statistics in other country:
AfghanistanAlbaniaAlgeriaAmerican SamoaAndorraAngolaAntigua and BarbudaArab WorldArgentinaArmeniaArubaAustraliaAustriaAzerbaijanBahamas, TheBahrainBangladeshBarbadosBelarusBelgiumBelizeBeninBermudaBhutanBoliviaBosnia and HerzegovinaBotswanaBrazilBritish Virgin IslandsBrunei DarussalamBulgariaBurkina FasoBurundiCabo VerdeCambodiaCameroonCanadaCaribbean small statesCayman IslandsCentral African RepublicCentral Europe and the BalticsChadChannel IslandsChileChinaColombiaComorosCongo, Dem. Rep.Congo, Rep.Costa RicaCote d'IvoireCroatiaCubaCuracaoCyprusCzech RepublicDenmarkDjiboutiDominicaDominican RepublicEarly-demographic dividendEast Asia & PacificEast Asia & Pacific (excluding high income)East Asia & Pacific (IDA & IBRD countries)EcuadorEgypt, Arab Rep.El SalvadorEquatorial GuineaEritreaEstoniaEthiopiaEuro areaEurope & Central AsiaEurope & Central Asia (excluding high income)Europe & Central Asia (IDA & IBRD countries)European UnionFaroe IslandsFijiFinlandFragile and conflict affected situationsFranceFrench PolynesiaGabonGambia, TheGeorgiaGermanyGhanaGibraltarGreeceGreenlandGrenadaGuamGuatemalaGuineaGuinea-BissauGuyanaHaitiHeavily indebted poor countries (HIPC)High incomeHondurasHong Kong SAR, ChinaHungaryIBRD onlyIcelandIDA & IBRD totalIDA blendIDA onlyIDA totalIndiaIndonesiaIran, Islamic Rep.IraqIrelandIsle of ManIsraelItalyJamaicaJapanJordanKazakhstanKenyaKiribatiKorea, Dem. People’s Rep.Korea, Rep.KuwaitKyrgyz RepublicLao PDRLate-demographic dividendLatin America & Caribbean Latin America & Caribbean (excluding high income)Latin America & the Caribbean (IDA & IBRD countries)LatviaLeast developed countries: UN classificationLebanonLesothoLiberiaLibyaLiechtensteinLithuaniaLow & middle incomeLow incomeLower middle incomeLuxembourgMacao SAR, ChinaMacedonia, FYRMadagascarMalawiMalaysiaMaldivesMaliMaltaMarshall IslandsMauritaniaMauritiusMexicoMicronesia, Fed. Sts.Middle East & North AfricaMiddle East & North Africa (excluding high income)Middle East & North Africa (IDA & IBRD countries)Middle incomeMoldovaMonacoMongoliaMontenegroMoroccoMozambiqueMyanmarNamibiaNauruNepalNetherlandsNew CaledoniaNew ZealandNicaraguaNigerNigeriaNorth AmericaNorthern Mariana IslandsNorwayOECD membersOmanOther small statesPacific island small statesPakistanPalauPanamaPapua New GuineaParaguayPeruPhilippinesPolandPortugalPost-demographic dividendPre-demographic dividendPuerto RicoQatarRomaniaRussian FederationRwandaSamoaSan MarinoSao Tome and PrincipeSaudi ArabiaSenegalSerbiaSeychellesSierra LeoneSingaporeSint Maarten (Dutch part)Slovak RepublicSloveniaSmall statesSolomon IslandsSomaliaSouth AfricaSouth AsiaSouth Asia (IDA & IBRD)South SudanSpainSri LankaSt. Kitts and NevisSt. LuciaSt. Vincent and the GrenadinesSub-Saharan Africa Sub-Saharan Africa (excluding high income)Sub-Saharan Africa (IDA & IBRD countries)SudanSurinameSwazilandSwedenSwitzerlandSyrian Arab RepublicTajikistanTanzaniaThailandTimor-LesteTogoTongaTrinidad and TobagoTunisiaTurkeyTurkmenistanTurks and Caicos IslandsTuvaluUgandaUkraineUnited Arab EmiratesUnited KingdomUnited StatesUpper middle incomeUruguayUzbekistanVanuatuVenezuela, RBVietnamVirgin Islands (U.S.)West Bank and GazaWorldYemen, Rep.ZambiaZimbabwe Timeline:
This timeline shows a graph from 1961 to 2016 of Uganda. No data until 1960. Number of actual observations by date: 56.
Source name:
World Development Indicators
Source organization:
United Nations, World Urbanization Prospects.
Categories, topics:
Climate Change, Urban Development
Last updated:
apr 23, 2017
Indicators value changes by year
Maximum:
16.101
jan 1, 2016
At the date of observation
Value
Absolute change
Change from previous value
jan 1, 1961
4.417
+4.417
0.0%
jan 1, 1962
4.617
+0.2
4.53%
jan 1, 1963
4.826
+0.209
4.53%
jan 1, 1964
5.045
+0.219
4.54%
jan 1, 1965
5.273
+0.228
4.52%
jan 1, 1966
5.509
+0.236
4.48%
jan 1, 1967
5.757
+0.248
4.5%
jan 1, 1968
6.014
+0.257
4.46%
jan 1, 1969
6.283
+0.269
4.47%
jan 1, 1970
6.562
+0.279
4.44%
jan 1, 1971
6.664
+0.102
1.55%
jan 1, 1972
6.737
+0.073
1.1%
jan 1, 1973
6.812
+0.075
1.11%
jan 1, 1974
6.887
+0.075
1.1%
jan 1, 1975
6.963
+0.076
1.1%
jan 1, 1976
7.04
+0.077
1.11%
jan 1, 1977
7.118
+0.078
1.11%
jan 1, 1978
7.197
+0.079
1.11%
jan 1, 1979
7.276
+0.079
1.1%
jan 1, 1980
7.356
+0.08
1.1%
jan 1, 1981
7.534
+0.178
2.42%
jan 1, 1982
7.834
+0.3
3.98%
jan 1, 1983
8.147
+0.313
4.0%
jan 1, 1984
8.47
+0.323
3.96%
jan 1, 1985
8.805
+0.335
3.96%
jan 1, 1986
9.152
+0.347
3.94%
jan 1, 1987
9.511
+0.359
3.92%
jan 1, 1988
9.882
+0.371
3.9%
jan 1, 1989
10.267
+0.385
3.9%
jan 1, 1990
10.665
+0.398
3.88%
jan 1, 1991
11.076
+0.411
3.85%
jan 1, 1992
11.338
+0.262
2.37%
jan 1, 1993
11.418
+0.08
0.71%
jan 1, 1994
11.499
+0.081
0.71%
jan 1, 1995
11.581
+0.082
0.71%
jan 1, 1996
11.663
+0.082
0.71%
jan 1, 1997
11.746
+0.083
0.71%
jan 1, 1998
11.829
+0.083
0.71%
jan 1, 1999
11.913
+0.084
0.71%
jan 1, 2000
11.997
+0.084
0.71%
jan 1, 2001
12.082
+0.085
0.71%
jan 1, 2002
12.167
+0.085
0.7%
jan 1, 2003
12.253
+0.086
0.71%
jan 1, 2004
12.483
+0.23
1.88%
jan 1, 2005
12.755
+0.272
2.18%
jan 1, 2006
13.031
+0.276
2.16%
jan 1, 2007
13.313
+0.282
2.16%
jan 1, 2008
13.6
+0.287
2.16%
jan 1, 2009
13.892
+0.292
2.15%
jan 1, 2010
14.189
+0.297
2.14%
jan 1, 2011
14.492
+0.303
2.14%
jan 1, 2012
14.8
+0.308
2.13%
jan 1, 2013
15.115
+0.315
2.13%
jan 1, 2014
15.437
+0.322
2.13%
jan 1, 2015
15.766
+0.329
2.13%
jan 1, 2016
16.101
+0.335
2.12%
Ranking of countries by current statistics by years


Comments: