29
/
en
AIzaSyAYiBZKx7MnpbEhh9jyipgxe19OcubqV5w
April 1, 2024
249608
Sri Lanka
LKA
true
2
1
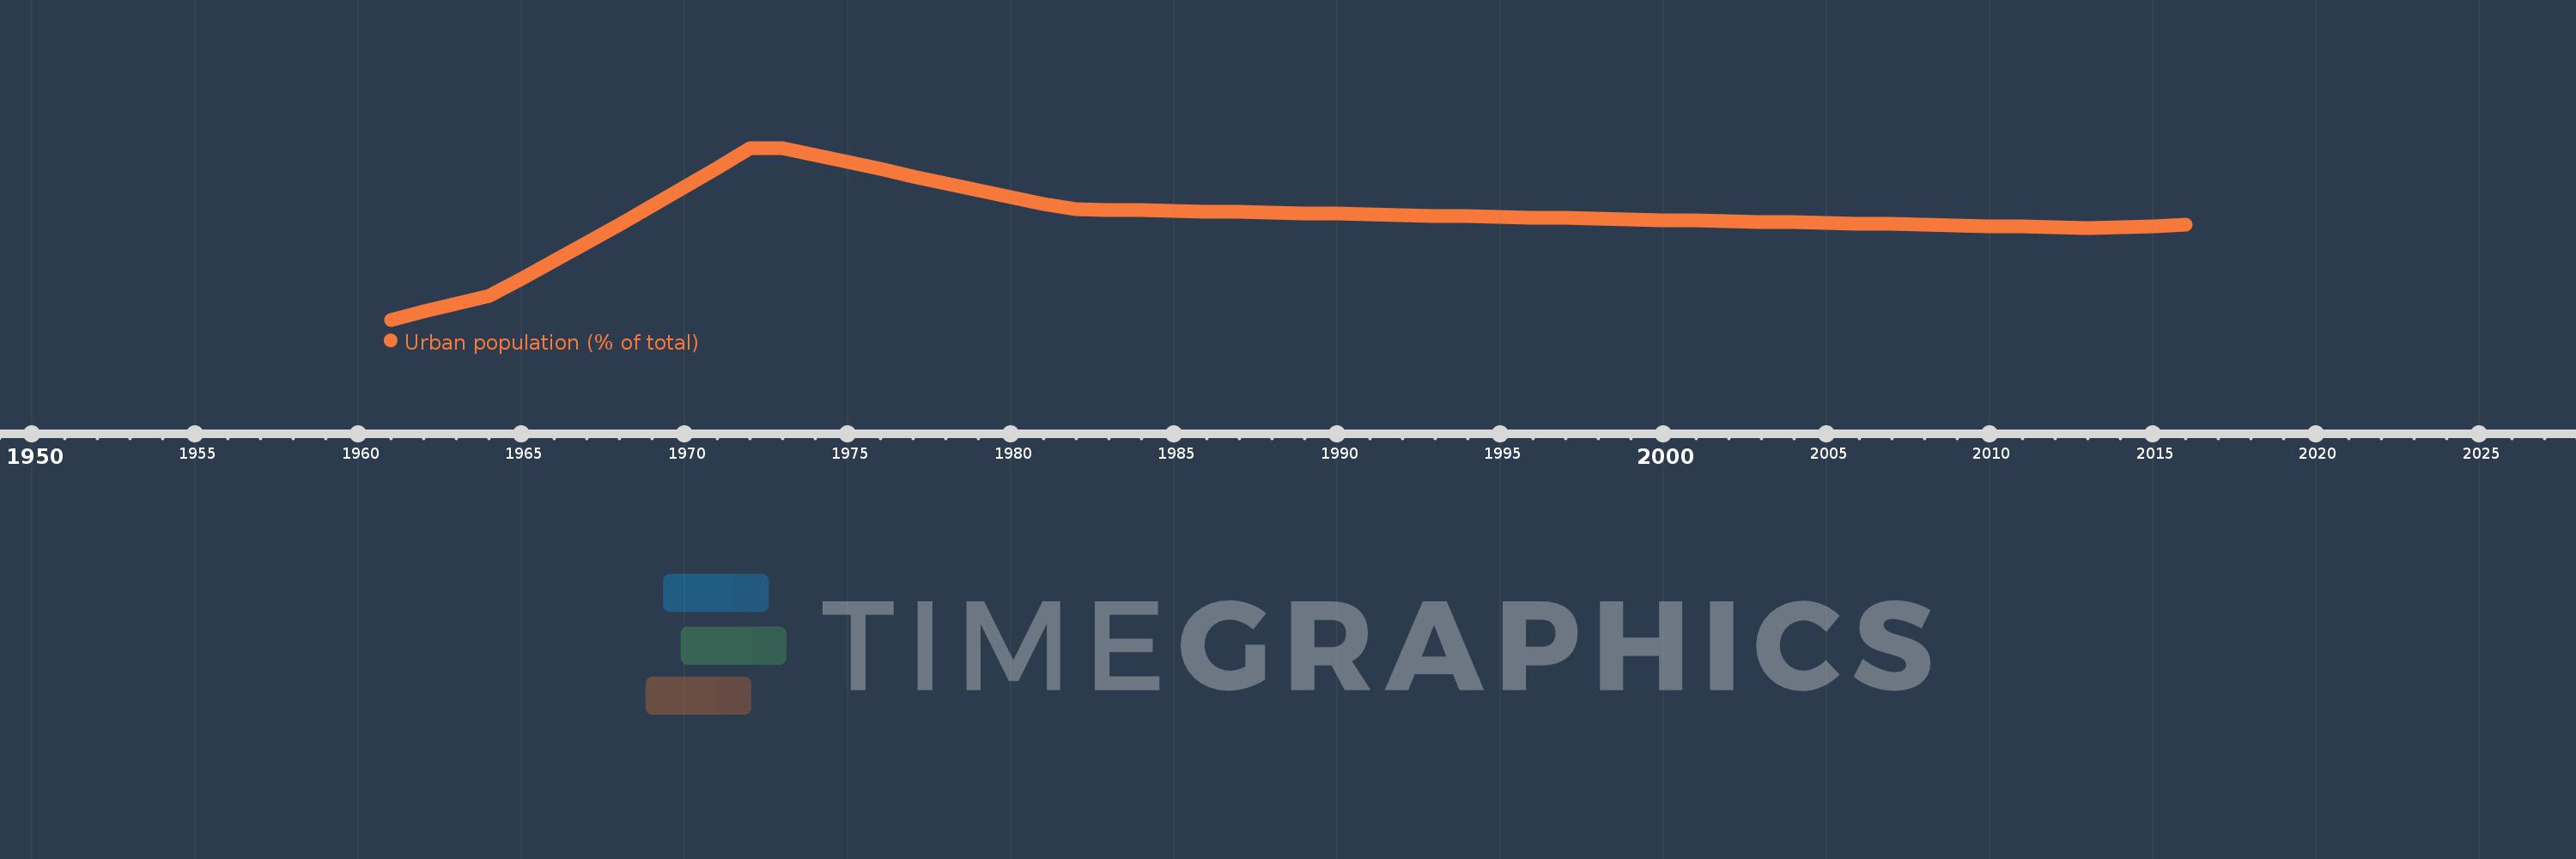
Urban population (% of total)
2016,2015,2014,2013,2012,2011,2010,2009,2008,2007,2006,2005,2004,2003,2002,2001,2000,1999,1998,1997,1996,1995,1994,1993,1992,1991,1990,1989,1988,1987,1986,1985,1984,1983,1982,1981,1980,1979,1978,1977,1976,1975,1974,1973,1972,1971,1970,1969,1968,1967,1966,1965,1964,1963,1962,1961
This statistics in other country:
AfghanistanAlbaniaAlgeriaAmerican SamoaAndorraAngolaAntigua and BarbudaArab WorldArgentinaArmeniaArubaAustraliaAustriaAzerbaijanBahamas, TheBahrainBangladeshBarbadosBelarusBelgiumBelizeBeninBermudaBhutanBoliviaBosnia and HerzegovinaBotswanaBrazilBritish Virgin IslandsBrunei DarussalamBulgariaBurkina FasoBurundiCabo VerdeCambodiaCameroonCanadaCaribbean small statesCayman IslandsCentral African RepublicCentral Europe and the BalticsChadChannel IslandsChileChinaColombiaComorosCongo, Dem. Rep.Congo, Rep.Costa RicaCote d'IvoireCroatiaCubaCuracaoCyprusCzech RepublicDenmarkDjiboutiDominicaDominican RepublicEarly-demographic dividendEast Asia & PacificEast Asia & Pacific (excluding high income)East Asia & Pacific (IDA & IBRD countries)EcuadorEgypt, Arab Rep.El SalvadorEquatorial GuineaEritreaEstoniaEthiopiaEuro areaEurope & Central AsiaEurope & Central Asia (excluding high income)Europe & Central Asia (IDA & IBRD countries)European UnionFaroe IslandsFijiFinlandFragile and conflict affected situationsFranceFrench PolynesiaGabonGambia, TheGeorgiaGermanyGhanaGibraltarGreeceGreenlandGrenadaGuamGuatemalaGuineaGuinea-BissauGuyanaHaitiHeavily indebted poor countries (HIPC)High incomeHondurasHong Kong SAR, ChinaHungaryIBRD onlyIcelandIDA & IBRD totalIDA blendIDA onlyIDA totalIndiaIndonesiaIran, Islamic Rep.IraqIrelandIsle of ManIsraelItalyJamaicaJapanJordanKazakhstanKenyaKiribatiKorea, Dem. People’s Rep.Korea, Rep.KuwaitKyrgyz RepublicLao PDRLate-demographic dividendLatin America & Caribbean Latin America & Caribbean (excluding high income)Latin America & the Caribbean (IDA & IBRD countries)LatviaLeast developed countries: UN classificationLebanonLesothoLiberiaLibyaLiechtensteinLithuaniaLow & middle incomeLow incomeLower middle incomeLuxembourgMacao SAR, ChinaMacedonia, FYRMadagascarMalawiMalaysiaMaldivesMaliMaltaMarshall IslandsMauritaniaMauritiusMexicoMicronesia, Fed. Sts.Middle East & North AfricaMiddle East & North Africa (excluding high income)Middle East & North Africa (IDA & IBRD countries)Middle incomeMoldovaMonacoMongoliaMontenegroMoroccoMozambiqueMyanmarNamibiaNauruNepalNetherlandsNew CaledoniaNew ZealandNicaraguaNigerNigeriaNorth AmericaNorthern Mariana IslandsNorwayOECD membersOmanOther small statesPacific island small statesPakistanPalauPanamaPapua New GuineaParaguayPeruPhilippinesPolandPortugalPost-demographic dividendPre-demographic dividendPuerto RicoQatarRomaniaRussian FederationRwandaSamoaSan MarinoSao Tome and PrincipeSaudi ArabiaSenegalSerbiaSeychellesSierra LeoneSingaporeSint Maarten (Dutch part)Slovak RepublicSloveniaSmall statesSolomon IslandsSomaliaSouth AfricaSouth AsiaSouth Asia (IDA & IBRD)South SudanSpainSri LankaSt. Kitts and NevisSt. LuciaSt. Vincent and the GrenadinesSub-Saharan Africa Sub-Saharan Africa (excluding high income)Sub-Saharan Africa (IDA & IBRD countries)SudanSurinameSwazilandSwedenSwitzerlandSyrian Arab RepublicTajikistanTanzaniaThailandTimor-LesteTogoTongaTrinidad and TobagoTunisiaTurkeyTurkmenistanTurks and Caicos IslandsTuvaluUgandaUkraineUnited Arab EmiratesUnited KingdomUnited StatesUpper middle incomeUruguayUzbekistanVanuatuVenezuela, RBVietnamVirgin Islands (U.S.)West Bank and GazaWorldYemen, Rep.ZambiaZimbabwe Timeline:
This timeline shows a graph from 1961 to 2016 of Sri Lanka. No data until 1960. Number of actual observations by date: 56.
Source name:
World Development Indicators
Source organization:
United Nations, World Urbanization Prospects.
Categories, topics:
Climate Change, Urban Development
Last updated:
apr 23, 2017
Indicators value changes by year
Minimum:
16.431
jan 1, 1961
Maximum:
19.915
jan 1, 1973
At the date of observation
Value
Absolute change
Change from previous value
jan 1, 1961
16.431
+16.431
0.0%
jan 1, 1962
16.592
+0.161
0.98%
jan 1, 1963
16.753
+0.161
0.97%
jan 1, 1964
16.916
+0.163
0.97%
jan 1, 1965
17.267
+0.351
2.07%
jan 1, 1966
17.626
+0.359
2.08%
jan 1, 1967
17.992
+0.366
2.08%
jan 1, 1968
18.364
+0.372
2.07%
jan 1, 1969
18.742
+0.378
2.06%
jan 1, 1970
19.125
+0.383
2.04%
jan 1, 1971
19.514
+0.389
2.03%
jan 1, 1972
19.91
+0.396
2.03%
jan 1, 1973
19.915
+0.005
0.03%
jan 1, 1974
19.77
-0.145
-0.73%
jan 1, 1975
19.626
-0.144
-0.73%
jan 1, 1976
19.483
-0.143
-0.73%
jan 1, 1977
19.34
-0.143
-0.73%
jan 1, 1978
19.199
-0.141
-0.73%
jan 1, 1979
19.058
-0.141
-0.73%
jan 1, 1980
18.918
-0.14
-0.73%
jan 1, 1981
18.779
-0.139
-0.73%
jan 1, 1982
18.676
-0.103
-0.55%
jan 1, 1983
18.664
-0.012
-0.06%
jan 1, 1984
18.652
-0.012
-0.06%
jan 1, 1985
18.639
-0.013
-0.07%
jan 1, 1986
18.627
-0.012
-0.06%
jan 1, 1987
18.615
-0.012
-0.06%
jan 1, 1988
18.602
-0.013
-0.07%
jan 1, 1989
18.59
-0.012
-0.06%
jan 1, 1990
18.578
-0.012
-0.06%
jan 1, 1991
18.566
-0.012
-0.06%
jan 1, 1992
18.553
-0.013
-0.07%
jan 1, 1993
18.541
-0.012
-0.06%
jan 1, 1994
18.529
-0.012
-0.06%
jan 1, 1995
18.516
-0.013
-0.07%
jan 1, 1996
18.504
-0.012
-0.06%
jan 1, 1997
18.492
-0.012
-0.06%
jan 1, 1998
18.48
-0.012
-0.06%
jan 1, 1999
18.467
-0.013
-0.07%
jan 1, 2000
18.455
-0.012
-0.06%
jan 1, 2001
18.443
-0.012
-0.07%
jan 1, 2002
18.431
-0.012
-0.07%
jan 1, 2003
18.418
-0.013
-0.07%
jan 1, 2004
18.406
-0.012
-0.07%
jan 1, 2005
18.394
-0.012
-0.07%
jan 1, 2006
18.382
-0.012
-0.07%
jan 1, 2007
18.37
-0.012
-0.07%
jan 1, 2008
18.357
-0.013
-0.07%
jan 1, 2009
18.345
-0.012
-0.07%
jan 1, 2010
18.333
-0.012
-0.07%
jan 1, 2011
18.321
-0.012
-0.07%
jan 1, 2012
18.309
-0.012
-0.07%
jan 1, 2013
18.297
-0.012
-0.07%
jan 1, 2014
18.3
+0.003
0.02%
jan 1, 2015
18.32
+0.02
0.11%
jan 1, 2016
18.356
+0.036
0.2%
Ranking of countries by current statistics by years


Comments: