29
/
en
AIzaSyAYiBZKx7MnpbEhh9jyipgxe19OcubqV5w
April 1, 2024
200011
Mongolia
MNG
true
2
1
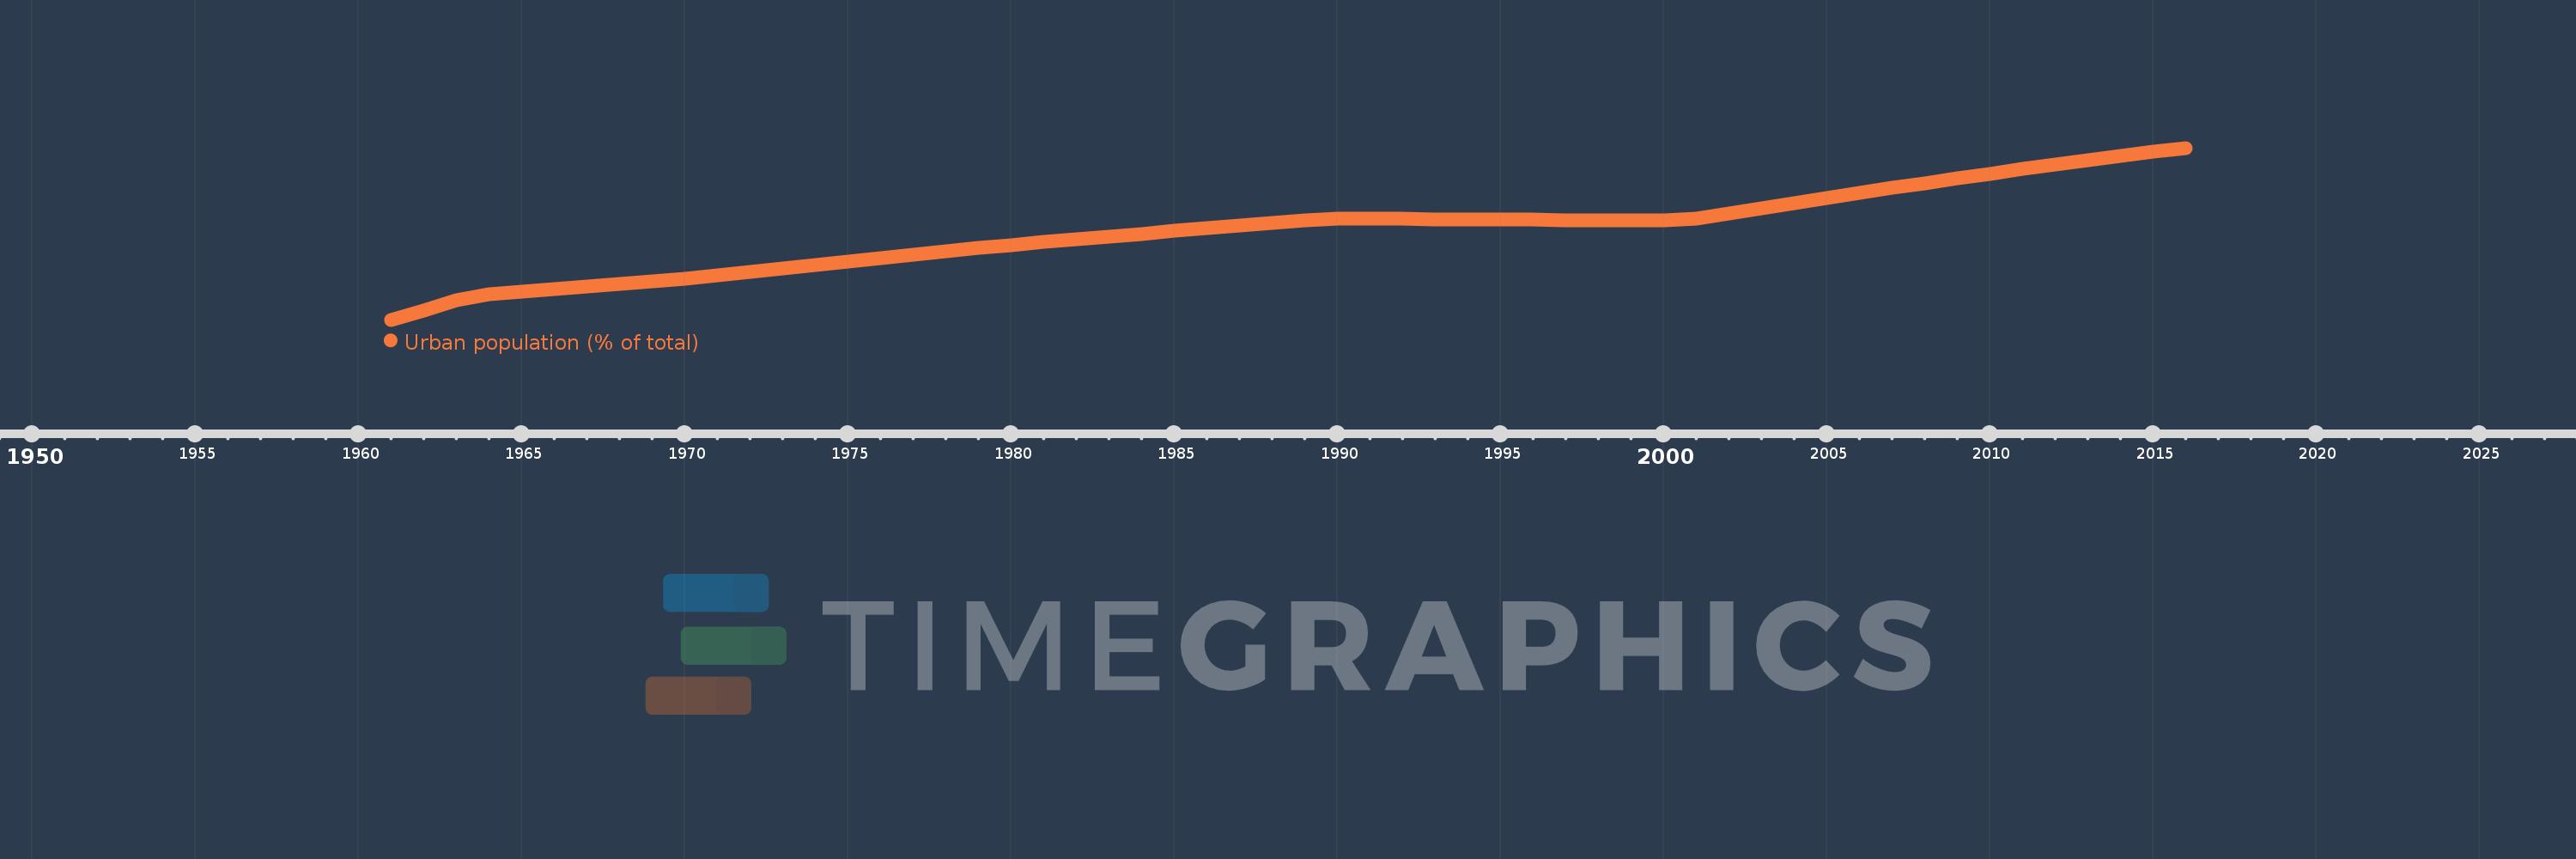
Urban population (% of total)
2016,2015,2014,2013,2012,2011,2010,2009,2008,2007,2006,2005,2004,2003,2002,2001,2000,1999,1998,1997,1996,1995,1994,1993,1992,1991,1990,1989,1988,1987,1986,1985,1984,1983,1982,1981,1980,1979,1978,1977,1976,1975,1974,1973,1972,1971,1970,1969,1968,1967,1966,1965,1964,1963,1962,1961
This statistics in other country:
AfghanistanAlbaniaAlgeriaAmerican SamoaAndorraAngolaAntigua and BarbudaArab WorldArgentinaArmeniaArubaAustraliaAustriaAzerbaijanBahamas, TheBahrainBangladeshBarbadosBelarusBelgiumBelizeBeninBermudaBhutanBoliviaBosnia and HerzegovinaBotswanaBrazilBritish Virgin IslandsBrunei DarussalamBulgariaBurkina FasoBurundiCabo VerdeCambodiaCameroonCanadaCaribbean small statesCayman IslandsCentral African RepublicCentral Europe and the BalticsChadChannel IslandsChileChinaColombiaComorosCongo, Dem. Rep.Congo, Rep.Costa RicaCote d'IvoireCroatiaCubaCuracaoCyprusCzech RepublicDenmarkDjiboutiDominicaDominican RepublicEarly-demographic dividendEast Asia & PacificEast Asia & Pacific (excluding high income)East Asia & Pacific (IDA & IBRD countries)EcuadorEgypt, Arab Rep.El SalvadorEquatorial GuineaEritreaEstoniaEthiopiaEuro areaEurope & Central AsiaEurope & Central Asia (excluding high income)Europe & Central Asia (IDA & IBRD countries)European UnionFaroe IslandsFijiFinlandFragile and conflict affected situationsFranceFrench PolynesiaGabonGambia, TheGeorgiaGermanyGhanaGibraltarGreeceGreenlandGrenadaGuamGuatemalaGuineaGuinea-BissauGuyanaHaitiHeavily indebted poor countries (HIPC)High incomeHondurasHong Kong SAR, ChinaHungaryIBRD onlyIcelandIDA & IBRD totalIDA blendIDA onlyIDA totalIndiaIndonesiaIran, Islamic Rep.IraqIrelandIsle of ManIsraelItalyJamaicaJapanJordanKazakhstanKenyaKiribatiKorea, Dem. People’s Rep.Korea, Rep.KuwaitKyrgyz RepublicLao PDRLate-demographic dividendLatin America & Caribbean Latin America & Caribbean (excluding high income)Latin America & the Caribbean (IDA & IBRD countries)LatviaLeast developed countries: UN classificationLebanonLesothoLiberiaLibyaLiechtensteinLithuaniaLow & middle incomeLow incomeLower middle incomeLuxembourgMacao SAR, ChinaMacedonia, FYRMadagascarMalawiMalaysiaMaldivesMaliMaltaMarshall IslandsMauritaniaMauritiusMexicoMicronesia, Fed. Sts.Middle East & North AfricaMiddle East & North Africa (excluding high income)Middle East & North Africa (IDA & IBRD countries)Middle incomeMoldovaMonacoMongoliaMontenegroMoroccoMozambiqueMyanmarNamibiaNauruNepalNetherlandsNew CaledoniaNew ZealandNicaraguaNigerNigeriaNorth AmericaNorthern Mariana IslandsNorwayOECD membersOmanOther small statesPacific island small statesPakistanPalauPanamaPapua New GuineaParaguayPeruPhilippinesPolandPortugalPost-demographic dividendPre-demographic dividendPuerto RicoQatarRomaniaRussian FederationRwandaSamoaSan MarinoSao Tome and PrincipeSaudi ArabiaSenegalSerbiaSeychellesSierra LeoneSingaporeSint Maarten (Dutch part)Slovak RepublicSloveniaSmall statesSolomon IslandsSomaliaSouth AfricaSouth AsiaSouth Asia (IDA & IBRD)South SudanSpainSri LankaSt. Kitts and NevisSt. LuciaSt. Vincent and the GrenadinesSub-Saharan Africa Sub-Saharan Africa (excluding high income)Sub-Saharan Africa (IDA & IBRD countries)SudanSurinameSwazilandSwedenSwitzerlandSyrian Arab RepublicTajikistanTanzaniaThailandTimor-LesteTogoTongaTrinidad and TobagoTunisiaTurkeyTurkmenistanTurks and Caicos IslandsTuvaluUgandaUkraineUnited Arab EmiratesUnited KingdomUnited StatesUpper middle incomeUruguayUzbekistanVanuatuVenezuela, RBVietnamVirgin Islands (U.S.)West Bank and GazaWorldYemen, Rep.ZambiaZimbabwe Timeline:
This timeline shows a graph from 1961 to 2016 of Mongolia. No data until 1960. Number of actual observations by date: 56.
Source name:
World Development Indicators
Source organization:
United Nations, World Urbanization Prospects.
Categories, topics:
Climate Change, Urban Development
Last updated:
apr 23, 2017
Indicators value changes by year
Minimum:
35.679
jan 1, 1961
At the date of observation
Value
Absolute change
Change from previous value
jan 1, 1961
35.679
+35.679
0.0%
jan 1, 1962
37.682
+2.003
5.61%
jan 1, 1963
39.73
+2.048
5.43%
jan 1, 1964
41.056
+1.326
3.34%
jan 1, 1965
41.585
+0.529
1.29%
jan 1, 1966
42.114
+0.529
1.27%
jan 1, 1967
42.647
+0.533
1.27%
jan 1, 1968
43.181
+0.534
1.25%
jan 1, 1969
43.717
+0.536
1.24%
jan 1, 1970
44.336
+0.619
1.42%
jan 1, 1971
45.052
+0.716
1.61%
jan 1, 1972
45.77
+0.718
1.59%
jan 1, 1973
46.491
+0.721
1.58%
jan 1, 1974
47.211
+0.72
1.55%
jan 1, 1975
47.933
+0.722
1.53%
jan 1, 1976
48.656
+0.723
1.51%
jan 1, 1977
49.381
+0.725
1.49%
jan 1, 1978
50.103
+0.722
1.46%
jan 1, 1979
50.827
+0.724
1.45%
jan 1, 1980
51.488
+0.661
1.3%
jan 1, 1981
52.083
+0.595
1.16%
jan 1, 1982
52.676
+0.593
1.14%
jan 1, 1983
53.268
+0.592
1.12%
jan 1, 1984
53.86
+0.592
1.11%
jan 1, 1985
54.452
+0.592
1.1%
jan 1, 1986
55.04
+0.588
1.08%
jan 1, 1987
55.628
+0.588
1.07%
jan 1, 1988
56.215
+0.587
1.06%
jan 1, 1989
56.8
+0.585
1.04%
jan 1, 1990
57.078
+0.278
0.49%
jan 1, 1991
57.033
-0.045
-0.08%
jan 1, 1992
56.987
-0.046
-0.08%
jan 1, 1993
56.942
-0.045
-0.08%
jan 1, 1994
56.896
-0.046
-0.08%
jan 1, 1995
56.851
-0.045
-0.08%
jan 1, 1996
56.805
-0.046
-0.08%
jan 1, 1997
56.76
-0.045
-0.08%
jan 1, 1998
56.714
-0.046
-0.08%
jan 1, 1999
56.669
-0.045
-0.08%
jan 1, 2000
56.623
-0.046
-0.08%
jan 1, 2001
57.133
+0.51
0.9%
jan 1, 2002
58.222
+1.089
1.91%
jan 1, 2003
59.304
+1.082
1.86%
jan 1, 2004
60.378
+1.074
1.81%
jan 1, 2005
61.443
+1.065
1.76%
jan 1, 2006
62.494
+1.051
1.71%
jan 1, 2007
63.535
+1.041
1.67%
jan 1, 2008
64.564
+1.029
1.62%
jan 1, 2009
65.581
+1.017
1.58%
jan 1, 2010
66.58
+0.999
1.52%
jan 1, 2011
67.567
+0.987
1.48%
jan 1, 2012
68.538
+0.971
1.44%
jan 1, 2013
69.472
+0.934
1.36%
jan 1, 2014
70.366
+0.894
1.29%
jan 1, 2015
71.222
+0.856
1.22%
jan 1, 2016
72.04
+0.818
1.15%
Ranking of countries by current statistics by years


Comments: