29
/
en
AIzaSyAYiBZKx7MnpbEhh9jyipgxe19OcubqV5w
April 1, 2024
123017
Dominican Republic
DOM
true
2
1
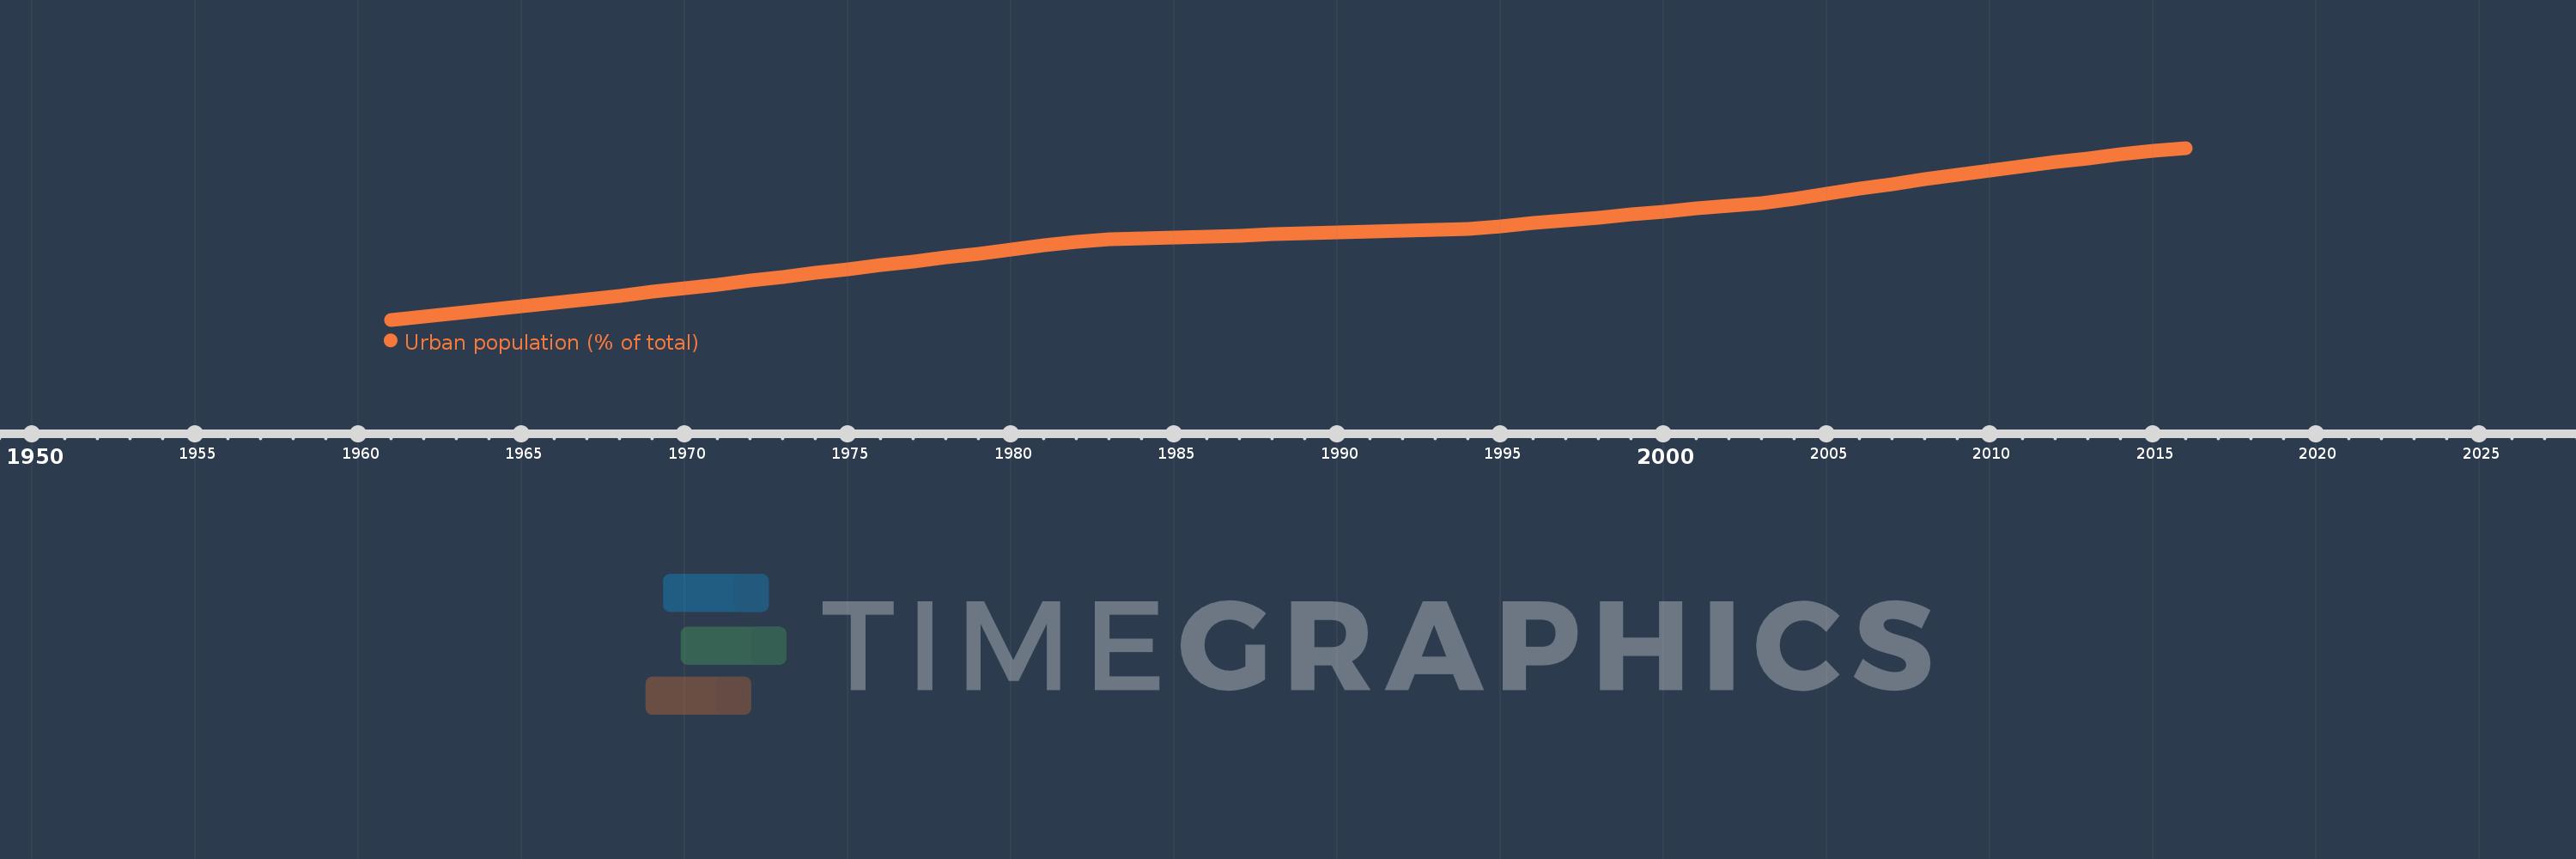
Urban population (% of total)
2016,2015,2014,2013,2012,2011,2010,2009,2008,2007,2006,2005,2004,2003,2002,2001,2000,1999,1998,1997,1996,1995,1994,1993,1992,1991,1990,1989,1988,1987,1986,1985,1984,1983,1982,1981,1980,1979,1978,1977,1976,1975,1974,1973,1972,1971,1970,1969,1968,1967,1966,1965,1964,1963,1962,1961
This statistics in other country:
AfghanistanAlbaniaAlgeriaAmerican SamoaAndorraAngolaAntigua and BarbudaArab WorldArgentinaArmeniaArubaAustraliaAustriaAzerbaijanBahamas, TheBahrainBangladeshBarbadosBelarusBelgiumBelizeBeninBermudaBhutanBoliviaBosnia and HerzegovinaBotswanaBrazilBritish Virgin IslandsBrunei DarussalamBulgariaBurkina FasoBurundiCabo VerdeCambodiaCameroonCanadaCaribbean small statesCayman IslandsCentral African RepublicCentral Europe and the BalticsChadChannel IslandsChileChinaColombiaComorosCongo, Dem. Rep.Congo, Rep.Costa RicaCote d'IvoireCroatiaCubaCuracaoCyprusCzech RepublicDenmarkDjiboutiDominicaDominican RepublicEarly-demographic dividendEast Asia & PacificEast Asia & Pacific (excluding high income)East Asia & Pacific (IDA & IBRD countries)EcuadorEgypt, Arab Rep.El SalvadorEquatorial GuineaEritreaEstoniaEthiopiaEuro areaEurope & Central AsiaEurope & Central Asia (excluding high income)Europe & Central Asia (IDA & IBRD countries)European UnionFaroe IslandsFijiFinlandFragile and conflict affected situationsFranceFrench PolynesiaGabonGambia, TheGeorgiaGermanyGhanaGibraltarGreeceGreenlandGrenadaGuamGuatemalaGuineaGuinea-BissauGuyanaHaitiHeavily indebted poor countries (HIPC)High incomeHondurasHong Kong SAR, ChinaHungaryIBRD onlyIcelandIDA & IBRD totalIDA blendIDA onlyIDA totalIndiaIndonesiaIran, Islamic Rep.IraqIrelandIsle of ManIsraelItalyJamaicaJapanJordanKazakhstanKenyaKiribatiKorea, Dem. People’s Rep.Korea, Rep.KuwaitKyrgyz RepublicLao PDRLate-demographic dividendLatin America & Caribbean Latin America & Caribbean (excluding high income)Latin America & the Caribbean (IDA & IBRD countries)LatviaLeast developed countries: UN classificationLebanonLesothoLiberiaLibyaLiechtensteinLithuaniaLow & middle incomeLow incomeLower middle incomeLuxembourgMacao SAR, ChinaMacedonia, FYRMadagascarMalawiMalaysiaMaldivesMaliMaltaMarshall IslandsMauritaniaMauritiusMexicoMicronesia, Fed. Sts.Middle East & North AfricaMiddle East & North Africa (excluding high income)Middle East & North Africa (IDA & IBRD countries)Middle incomeMoldovaMonacoMongoliaMontenegroMoroccoMozambiqueMyanmarNamibiaNauruNepalNetherlandsNew CaledoniaNew ZealandNicaraguaNigerNigeriaNorth AmericaNorthern Mariana IslandsNorwayOECD membersOmanOther small statesPacific island small statesPakistanPalauPanamaPapua New GuineaParaguayPeruPhilippinesPolandPortugalPost-demographic dividendPre-demographic dividendPuerto RicoQatarRomaniaRussian FederationRwandaSamoaSan MarinoSao Tome and PrincipeSaudi ArabiaSenegalSerbiaSeychellesSierra LeoneSingaporeSint Maarten (Dutch part)Slovak RepublicSloveniaSmall statesSolomon IslandsSomaliaSouth AfricaSouth AsiaSouth Asia (IDA & IBRD)South SudanSpainSri LankaSt. Kitts and NevisSt. LuciaSt. Vincent and the GrenadinesSub-Saharan Africa Sub-Saharan Africa (excluding high income)Sub-Saharan Africa (IDA & IBRD countries)SudanSurinameSwazilandSwedenSwitzerlandSyrian Arab RepublicTajikistanTanzaniaThailandTimor-LesteTogoTongaTrinidad and TobagoTunisiaTurkeyTurkmenistanTurks and Caicos IslandsTuvaluUgandaUkraineUnited Arab EmiratesUnited KingdomUnited StatesUpper middle incomeUruguayUzbekistanVanuatuVenezuela, RBVietnamVirgin Islands (U.S.)West Bank and GazaWorldYemen, Rep.ZambiaZimbabwe Timeline:
This timeline shows a graph from 1961 to 2016 of Dominican Republic. No data until 1960. Number of actual observations by date: 56.
Source name:
World Development Indicators
Source organization:
United Nations, World Urbanization Prospects.
Categories, topics:
Climate Change, Urban Development
Last updated:
apr 23, 2017
Indicators value changes by year
Minimum:
30.229
jan 1, 1961
At the date of observation
Value
Absolute change
Change from previous value
jan 1, 1961
30.229
+30.229
0.0%
jan 1, 1962
31.141
+0.912
3.02%
jan 1, 1963
32.094
+0.953
3.06%
jan 1, 1964
33.061
+0.967
3.01%
jan 1, 1965
34.044
+0.983
2.97%
jan 1, 1966
35.039
+0.995
2.92%
jan 1, 1967
36.048
+1.009
2.88%
jan 1, 1968
37.069
+1.021
2.83%
jan 1, 1969
38.104
+1.035
2.79%
jan 1, 1970
39.147
+1.043
2.74%
jan 1, 1971
40.209
+1.062
2.71%
jan 1, 1972
41.291
+1.082
2.69%
jan 1, 1973
42.382
+1.091
2.64%
jan 1, 1974
43.478
+1.096
2.59%
jan 1, 1975
44.582
+1.104
2.54%
jan 1, 1976
45.691
+1.109
2.49%
jan 1, 1977
46.807
+1.116
2.44%
jan 1, 1978
47.922
+1.115
2.38%
jan 1, 1979
49.041
+1.119
2.34%
jan 1, 1980
50.16
+1.119
2.28%
jan 1, 1981
51.281
+1.121
2.23%
jan 1, 1982
52.398
+1.117
2.18%
jan 1, 1983
53.05
+0.652
1.24%
jan 1, 1984
53.323
+0.273
0.51%
jan 1, 1985
53.596
+0.273
0.51%
jan 1, 1986
53.868
+0.272
0.51%
jan 1, 1987
54.14
+0.272
0.5%
jan 1, 1988
54.412
+0.272
0.5%
jan 1, 1989
54.684
+0.272
0.5%
jan 1, 1990
54.955
+0.271
0.5%
jan 1, 1991
55.226
+0.271
0.49%
jan 1, 1992
55.497
+0.271
0.49%
jan 1, 1993
55.767
+0.27
0.49%
jan 1, 1994
56.037
+0.27
0.48%
jan 1, 1995
56.751
+0.714
1.27%
jan 1, 1996
57.596
+0.845
1.49%
jan 1, 1997
58.437
+0.841
1.46%
jan 1, 1998
59.272
+0.835
1.43%
jan 1, 1999
60.102
+0.83
1.4%
jan 1, 2000
60.926
+0.824
1.37%
jan 1, 2001
61.746
+0.82
1.35%
jan 1, 2002
62.556
+0.81
1.31%
jan 1, 2003
63.361
+0.805
1.29%
jan 1, 2004
64.596
+1.235
1.95%
jan 1, 2005
65.995
+1.399
2.17%
jan 1, 2006
67.364
+1.369
2.07%
jan 1, 2007
68.705
+1.341
1.99%
jan 1, 2008
70.016
+1.311
1.91%
jan 1, 2009
71.297
+1.281
1.83%
jan 1, 2010
72.541
+1.244
1.74%
jan 1, 2011
73.752
+1.211
1.67%
jan 1, 2012
74.929
+1.177
1.6%
jan 1, 2013
76.039
+1.11
1.48%
jan 1, 2014
77.082
+1.043
1.37%
jan 1, 2015
78.061
+0.979
1.27%
jan 1, 2016
78.98
+0.919
1.18%
Ranking of countries by current statistics by years


Comments: