29
/
en
AIzaSyAYiBZKx7MnpbEhh9jyipgxe19OcubqV5w
April 1, 2024
233315
San Marino
SMR
true
2
1
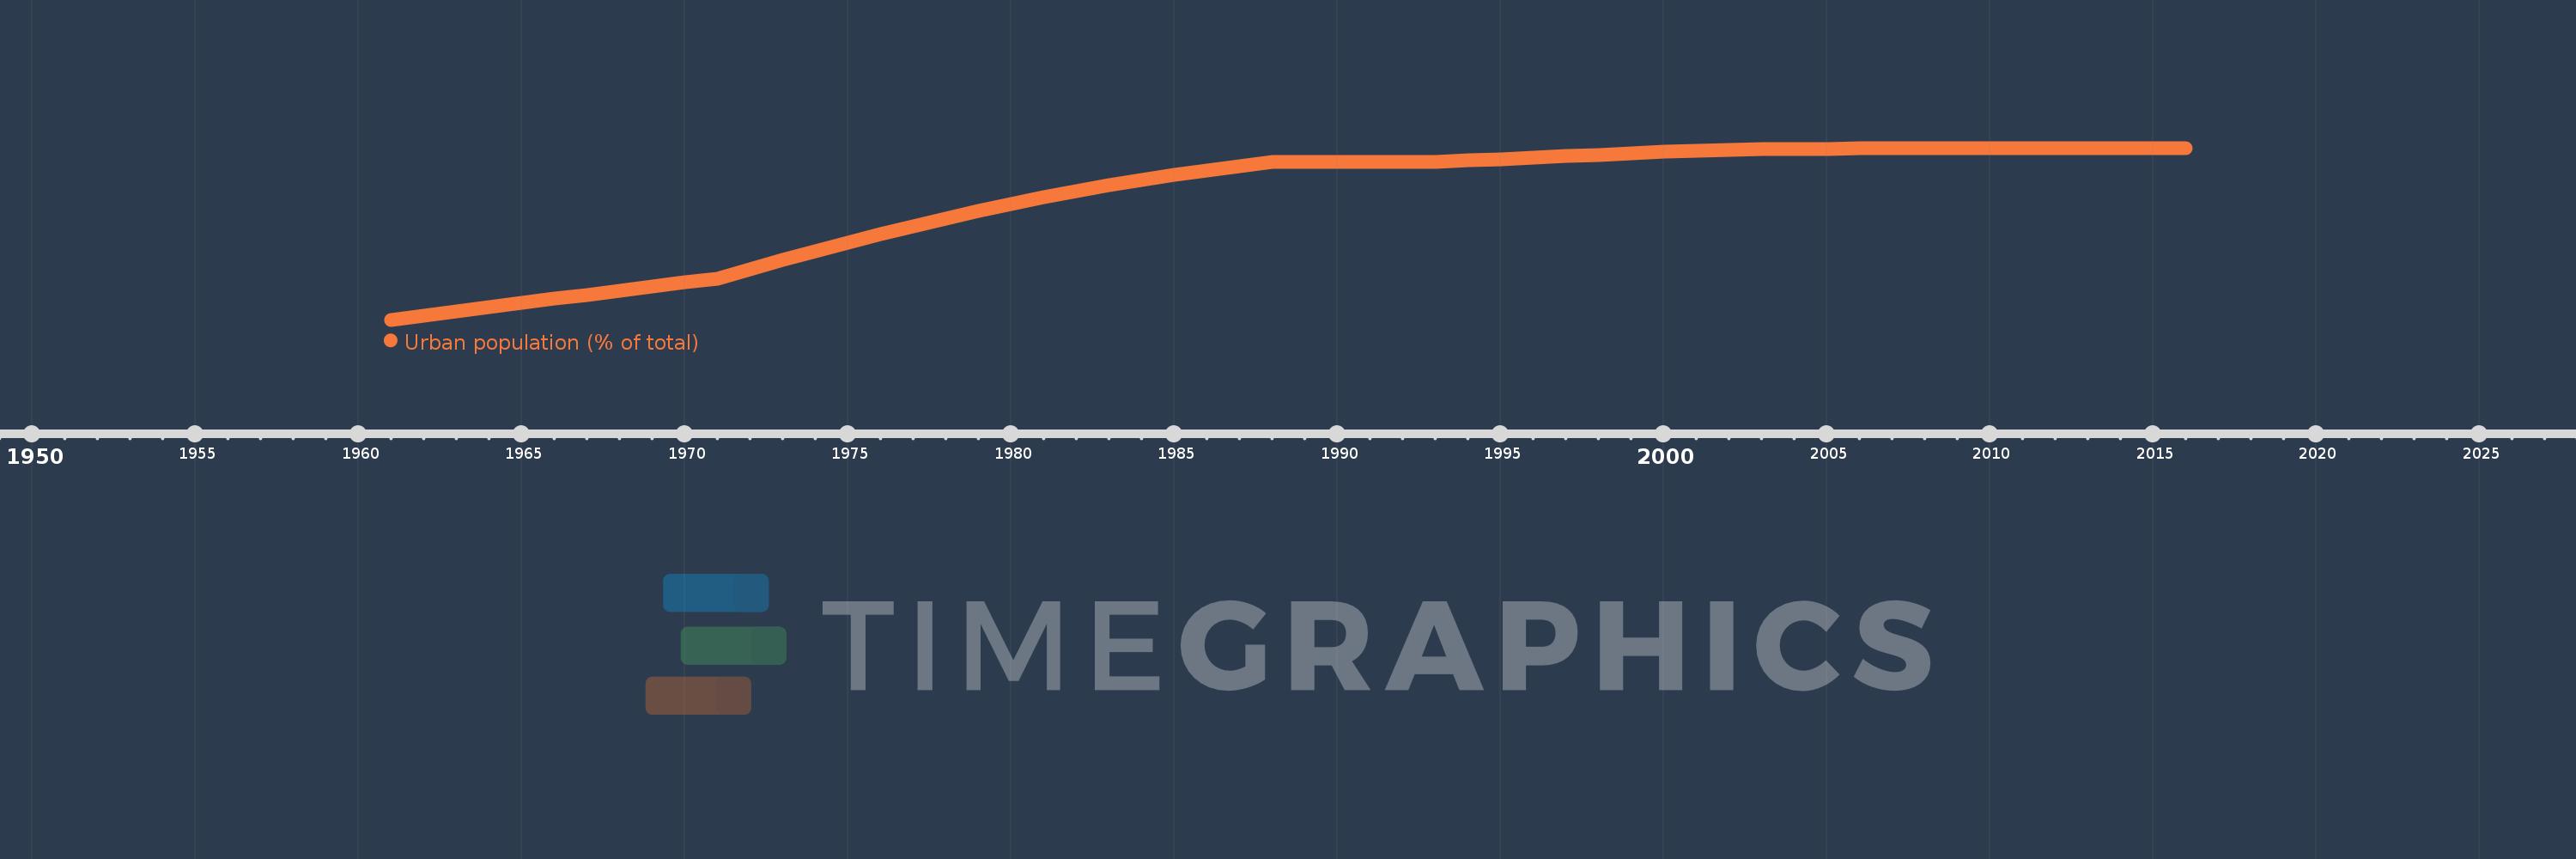
Urban population (% of total)
2016,2015,2014,2013,2012,2011,2010,2009,2008,2007,2006,2005,2004,2003,2002,2001,2000,1999,1998,1997,1996,1995,1994,1993,1992,1991,1990,1989,1988,1987,1986,1985,1984,1983,1982,1981,1980,1979,1978,1977,1976,1975,1974,1973,1972,1971,1970,1969,1968,1967,1966,1965,1964,1963,1962,1961
This statistics in other country:
AfghanistanAlbaniaAlgeriaAmerican SamoaAndorraAngolaAntigua and BarbudaArab WorldArgentinaArmeniaArubaAustraliaAustriaAzerbaijanBahamas, TheBahrainBangladeshBarbadosBelarusBelgiumBelizeBeninBermudaBhutanBoliviaBosnia and HerzegovinaBotswanaBrazilBritish Virgin IslandsBrunei DarussalamBulgariaBurkina FasoBurundiCabo VerdeCambodiaCameroonCanadaCaribbean small statesCayman IslandsCentral African RepublicCentral Europe and the BalticsChadChannel IslandsChileChinaColombiaComorosCongo, Dem. Rep.Congo, Rep.Costa RicaCote d'IvoireCroatiaCubaCuracaoCyprusCzech RepublicDenmarkDjiboutiDominicaDominican RepublicEarly-demographic dividendEast Asia & PacificEast Asia & Pacific (excluding high income)East Asia & Pacific (IDA & IBRD countries)EcuadorEgypt, Arab Rep.El SalvadorEquatorial GuineaEritreaEstoniaEthiopiaEuro areaEurope & Central AsiaEurope & Central Asia (excluding high income)Europe & Central Asia (IDA & IBRD countries)European UnionFaroe IslandsFijiFinlandFragile and conflict affected situationsFranceFrench PolynesiaGabonGambia, TheGeorgiaGermanyGhanaGibraltarGreeceGreenlandGrenadaGuamGuatemalaGuineaGuinea-BissauGuyanaHaitiHeavily indebted poor countries (HIPC)High incomeHondurasHong Kong SAR, ChinaHungaryIBRD onlyIcelandIDA & IBRD totalIDA blendIDA onlyIDA totalIndiaIndonesiaIran, Islamic Rep.IraqIrelandIsle of ManIsraelItalyJamaicaJapanJordanKazakhstanKenyaKiribatiKorea, Dem. People’s Rep.Korea, Rep.KuwaitKyrgyz RepublicLao PDRLate-demographic dividendLatin America & Caribbean Latin America & Caribbean (excluding high income)Latin America & the Caribbean (IDA & IBRD countries)LatviaLeast developed countries: UN classificationLebanonLesothoLiberiaLibyaLiechtensteinLithuaniaLow & middle incomeLow incomeLower middle incomeLuxembourgMacao SAR, ChinaMacedonia, FYRMadagascarMalawiMalaysiaMaldivesMaliMaltaMarshall IslandsMauritaniaMauritiusMexicoMicronesia, Fed. Sts.Middle East & North AfricaMiddle East & North Africa (excluding high income)Middle East & North Africa (IDA & IBRD countries)Middle incomeMoldovaMonacoMongoliaMontenegroMoroccoMozambiqueMyanmarNamibiaNauruNepalNetherlandsNew CaledoniaNew ZealandNicaraguaNigerNigeriaNorth AmericaNorthern Mariana IslandsNorwayOECD membersOmanOther small statesPacific island small statesPakistanPalauPanamaPapua New GuineaParaguayPeruPhilippinesPolandPortugalPost-demographic dividendPre-demographic dividendPuerto RicoQatarRomaniaRussian FederationRwandaSamoaSan MarinoSao Tome and PrincipeSaudi ArabiaSenegalSerbiaSeychellesSierra LeoneSingaporeSint Maarten (Dutch part)Slovak RepublicSloveniaSmall statesSolomon IslandsSomaliaSouth AfricaSouth AsiaSouth Asia (IDA & IBRD)South SudanSpainSri LankaSt. Kitts and NevisSt. LuciaSt. Vincent and the GrenadinesSub-Saharan Africa Sub-Saharan Africa (excluding high income)Sub-Saharan Africa (IDA & IBRD countries)SudanSurinameSwazilandSwedenSwitzerlandSyrian Arab RepublicTajikistanTanzaniaThailandTimor-LesteTogoTongaTrinidad and TobagoTunisiaTurkeyTurkmenistanTurks and Caicos IslandsTuvaluUgandaUkraineUnited Arab EmiratesUnited KingdomUnited StatesUpper middle incomeUruguayUzbekistanVanuatuVenezuela, RBVietnamVirgin Islands (U.S.)West Bank and GazaWorldYemen, Rep.ZambiaZimbabwe Timeline:
This timeline shows a graph from 1961 to 2016 of San Marino. No data until 1960. Number of actual observations by date: 56.
Source name:
World Development Indicators
Source organization:
United Nations, World Urbanization Prospects.
Categories, topics:
Climate Change, Urban Development
Last updated:
apr 23, 2017
Indicators value changes by year
At the date of observation
Value
Absolute change
Change from previous value
jan 1, 1961
48.9
+48.9
0.0%
jan 1, 1962
50.001
+1.101
2.25%
jan 1, 1963
51.104
+1.103
2.21%
jan 1, 1964
52.206
+1.102
2.16%
jan 1, 1965
53.307
+1.101
2.11%
jan 1, 1966
54.402
+1.095
2.05%
jan 1, 1967
55.494
+1.092
2.01%
jan 1, 1968
56.581
+1.087
1.96%
jan 1, 1969
57.663
+1.082
1.91%
jan 1, 1970
58.735
+1.072
1.86%
jan 1, 1971
59.8
+1.065
1.81%
jan 1, 1972
62.281
+2.481
4.15%
jan 1, 1973
64.703
+2.422
3.89%
jan 1, 1974
67.046
+2.343
3.62%
jan 1, 1975
69.309
+2.263
3.38%
jan 1, 1976
71.484
+2.175
3.14%
jan 1, 1977
73.566
+2.082
2.91%
jan 1, 1978
75.615
+2.049
2.79%
jan 1, 1979
77.604
+1.989
2.63%
jan 1, 1980
79.475
+1.871
2.41%
jan 1, 1981
81.231
+1.756
2.21%
jan 1, 1982
82.864
+1.633
2.01%
jan 1, 1983
84.384
+1.52
1.83%
jan 1, 1984
85.792
+1.408
1.67%
jan 1, 1985
87.095
+1.303
1.52%
jan 1, 1986
88.291
+1.196
1.37%
jan 1, 1987
89.392
+1.101
1.25%
jan 1, 1988
90.4
+1.008
1.13%
jan 1, 1994
90.839
+0.439
0.49%
jan 1, 1995
91.261
+0.422
0.46%
jan 1, 1996
91.664
+0.403
0.44%
jan 1, 1997
92.052
+0.388
0.42%
jan 1, 1998
92.422
+0.37
0.4%
jan 1, 1999
92.776
+0.354
0.38%
jan 1, 2000
93.115
+0.339
0.37%
jan 1, 2001
93.44
+0.325
0.35%
jan 1, 2002
93.75
+0.31
0.33%
jan 1, 2003
93.925
+0.175
0.19%
jan 1, 2004
93.975
+0.05
0.05%
jan 1, 2005
94.006
+0.031
0.03%
jan 1, 2006
94.019
+0.013
0.01%
jan 1, 2007
94.031
+0.012
0.01%
jan 1, 2008
94.044
+0.013
0.01%
jan 1, 2009
94.056
+0.012
0.01%
jan 1, 2010
94.07
+0.014
0.01%
jan 1, 2011
94.086
+0.016
0.02%
jan 1, 2012
94.104
+0.018
0.02%
jan 1, 2013
94.123
+0.019
0.02%
jan 1, 2014
94.144
+0.021
0.02%
jan 1, 2015
94.166
+0.022
0.02%
jan 1, 2016
94.19
+0.024
0.03%
Ranking of countries by current statistics by years


Comments: