29
/
en
AIzaSyAYiBZKx7MnpbEhh9jyipgxe19OcubqV5w
April 1, 2024
59455
Sub-Saharan Africa
SSF
false
2
1
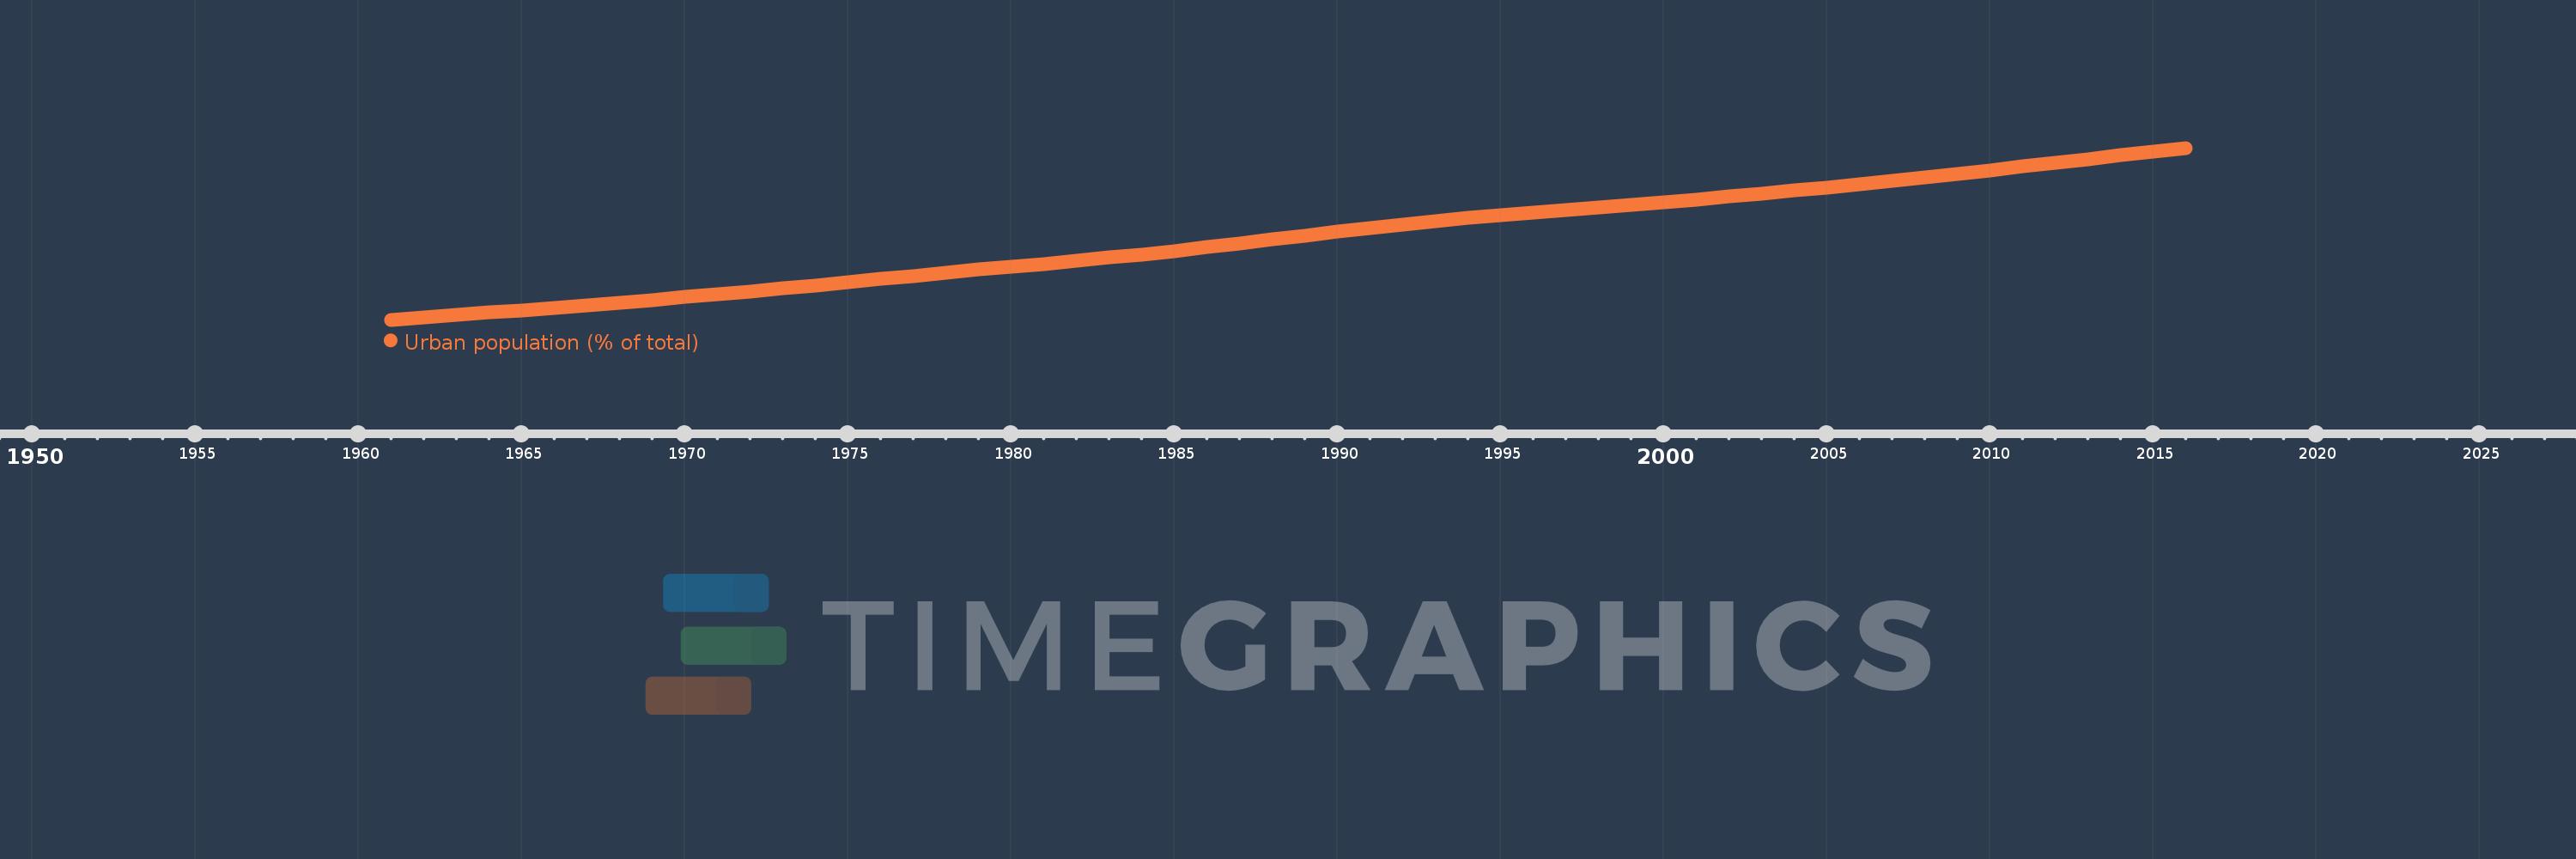
Urban population (% of total)
2016,2015,2014,2013,2012,2011,2010,2009,2008,2007,2006,2005,2004,2003,2002,2001,2000,1999,1998,1997,1996,1995,1994,1993,1992,1991,1990,1989,1988,1987,1986,1985,1984,1983,1982,1981,1980,1979,1978,1977,1976,1975,1974,1973,1972,1971,1970,1969,1968,1967,1966,1965,1964,1963,1962,1961
This statistics in other country:
AfghanistanAlbaniaAlgeriaAmerican SamoaAndorraAngolaAntigua and BarbudaArab WorldArgentinaArmeniaArubaAustraliaAustriaAzerbaijanBahamas, TheBahrainBangladeshBarbadosBelarusBelgiumBelizeBeninBermudaBhutanBoliviaBosnia and HerzegovinaBotswanaBrazilBritish Virgin IslandsBrunei DarussalamBulgariaBurkina FasoBurundiCabo VerdeCambodiaCameroonCanadaCaribbean small statesCayman IslandsCentral African RepublicCentral Europe and the BalticsChadChannel IslandsChileChinaColombiaComorosCongo, Dem. Rep.Congo, Rep.Costa RicaCote d'IvoireCroatiaCubaCuracaoCyprusCzech RepublicDenmarkDjiboutiDominicaDominican RepublicEarly-demographic dividendEast Asia & PacificEast Asia & Pacific (excluding high income)East Asia & Pacific (IDA & IBRD countries)EcuadorEgypt, Arab Rep.El SalvadorEquatorial GuineaEritreaEstoniaEthiopiaEuro areaEurope & Central AsiaEurope & Central Asia (excluding high income)Europe & Central Asia (IDA & IBRD countries)European UnionFaroe IslandsFijiFinlandFragile and conflict affected situationsFranceFrench PolynesiaGabonGambia, TheGeorgiaGermanyGhanaGibraltarGreeceGreenlandGrenadaGuamGuatemalaGuineaGuinea-BissauGuyanaHaitiHeavily indebted poor countries (HIPC)High incomeHondurasHong Kong SAR, ChinaHungaryIBRD onlyIcelandIDA & IBRD totalIDA blendIDA onlyIDA totalIndiaIndonesiaIran, Islamic Rep.IraqIrelandIsle of ManIsraelItalyJamaicaJapanJordanKazakhstanKenyaKiribatiKorea, Dem. People’s Rep.Korea, Rep.KuwaitKyrgyz RepublicLao PDRLate-demographic dividendLatin America & Caribbean Latin America & Caribbean (excluding high income)Latin America & the Caribbean (IDA & IBRD countries)LatviaLeast developed countries: UN classificationLebanonLesothoLiberiaLibyaLiechtensteinLithuaniaLow & middle incomeLow incomeLower middle incomeLuxembourgMacao SAR, ChinaMacedonia, FYRMadagascarMalawiMalaysiaMaldivesMaliMaltaMarshall IslandsMauritaniaMauritiusMexicoMicronesia, Fed. Sts.Middle East & North AfricaMiddle East & North Africa (excluding high income)Middle East & North Africa (IDA & IBRD countries)Middle incomeMoldovaMonacoMongoliaMontenegroMoroccoMozambiqueMyanmarNamibiaNauruNepalNetherlandsNew CaledoniaNew ZealandNicaraguaNigerNigeriaNorth AmericaNorthern Mariana IslandsNorwayOECD membersOmanOther small statesPacific island small statesPakistanPalauPanamaPapua New GuineaParaguayPeruPhilippinesPolandPortugalPost-demographic dividendPre-demographic dividendPuerto RicoQatarRomaniaRussian FederationRwandaSamoaSan MarinoSao Tome and PrincipeSaudi ArabiaSenegalSerbiaSeychellesSierra LeoneSingaporeSint Maarten (Dutch part)Slovak RepublicSloveniaSmall statesSolomon IslandsSomaliaSouth AfricaSouth AsiaSouth Asia (IDA & IBRD)South SudanSpainSri LankaSt. Kitts and NevisSt. LuciaSt. Vincent and the GrenadinesSub-Saharan Africa Sub-Saharan Africa (excluding high income)Sub-Saharan Africa (IDA & IBRD countries)SudanSurinameSwazilandSwedenSwitzerlandSyrian Arab RepublicTajikistanTanzaniaThailandTimor-LesteTogoTongaTrinidad and TobagoTunisiaTurkeyTurkmenistanTurks and Caicos IslandsTuvaluUgandaUkraineUnited Arab EmiratesUnited KingdomUnited StatesUpper middle incomeUruguayUzbekistanVanuatuVenezuela, RBVietnamVirgin Islands (U.S.)West Bank and GazaWorldYemen, Rep.ZambiaZimbabwe Timeline:
This timeline shows a graph from 1961 to 2016 of Sub-Saharan Africa . No data until 1960. Number of actual observations by date: 56.
Source name:
World Development Indicators
Source organization:
United Nations, World Urbanization Prospects.
Categories, topics:
Climate Change, Urban Development
Last updated:
apr 23, 2017
Indicators value changes by year
Minimum:
14.631
jan 1, 1961
Maximum:
37.739
jan 1, 2016
At the date of observation
Value
Absolute change
Change from previous value
jan 1, 1961
14.631
+14.631
0.0%
jan 1, 1962
14.948
+0.316
2.16%
jan 1, 1963
15.26
+0.313
2.09%
jan 1, 1964
15.585
+0.325
2.13%
jan 1, 1965
15.921
+0.336
2.15%
jan 1, 1966
16.265
+0.344
2.16%
jan 1, 1967
16.603
+0.338
2.08%
jan 1, 1968
16.948
+0.345
2.08%
jan 1, 1969
17.304
+0.355
2.1%
jan 1, 1970
17.671
+0.367
2.12%
jan 1, 1971
18.031
+0.36
2.04%
jan 1, 1972
18.429
+0.397
2.2%
jan 1, 1973
18.839
+0.411
2.23%
jan 1, 1974
19.252
+0.413
2.19%
jan 1, 1975
19.664
+0.412
2.14%
jan 1, 1976
20.089
+0.425
2.16%
jan 1, 1977
20.529
+0.44
2.19%
jan 1, 1978
20.962
+0.433
2.11%
jan 1, 1979
21.4
+0.439
2.09%
jan 1, 1980
21.786
+0.385
1.8%
jan 1, 1981
22.153
+0.367
1.68%
jan 1, 1982
22.564
+0.412
1.86%
jan 1, 1983
22.981
+0.417
1.85%
jan 1, 1984
23.418
+0.436
1.9%
jan 1, 1985
23.887
+0.47
2.01%
jan 1, 1986
24.394
+0.506
2.12%
jan 1, 1987
24.915
+0.521
2.14%
jan 1, 1988
25.432
+0.517
2.07%
jan 1, 1989
25.948
+0.516
2.03%
jan 1, 1990
26.46
+0.512
1.97%
jan 1, 1991
26.993
+0.533
2.01%
jan 1, 1992
27.441
+0.447
1.66%
jan 1, 1993
27.875
+0.434
1.58%
jan 1, 1994
28.297
+0.423
1.52%
jan 1, 1995
28.665
+0.368
1.3%
jan 1, 1996
29.019
+0.355
1.24%
jan 1, 1997
29.367
+0.347
1.2%
jan 1, 1998
29.719
+0.352
1.2%
jan 1, 1999
30.062
+0.343
1.15%
jan 1, 2000
30.41
+0.348
1.16%
jan 1, 2001
30.765
+0.355
1.17%
jan 1, 2002
31.177
+0.412
1.34%
jan 1, 2003
31.587
+0.409
1.31%
jan 1, 2004
32.007
+0.42
1.33%
jan 1, 2005
32.434
+0.427
1.33%
jan 1, 2006
32.873
+0.44
1.36%
jan 1, 2007
33.32
+0.446
1.36%
jan 1, 2008
33.775
+0.456
1.37%
jan 1, 2009
34.255
+0.48
1.42%
jan 1, 2010
34.74
+0.485
1.42%
jan 1, 2011
35.232
+0.492
1.42%
jan 1, 2012
35.728
+0.496
1.41%
jan 1, 2013
36.228
+0.5
1.4%
jan 1, 2014
36.729
+0.501
1.38%
jan 1, 2015
37.233
+0.504
1.37%
jan 1, 2016
37.739
+0.506
1.36%
Ranking of countries by current statistics by years


Comments: