29
/
en
AIzaSyAYiBZKx7MnpbEhh9jyipgxe19OcubqV5w
April 1, 2024
236626
Senegal
SEN
true
2
1
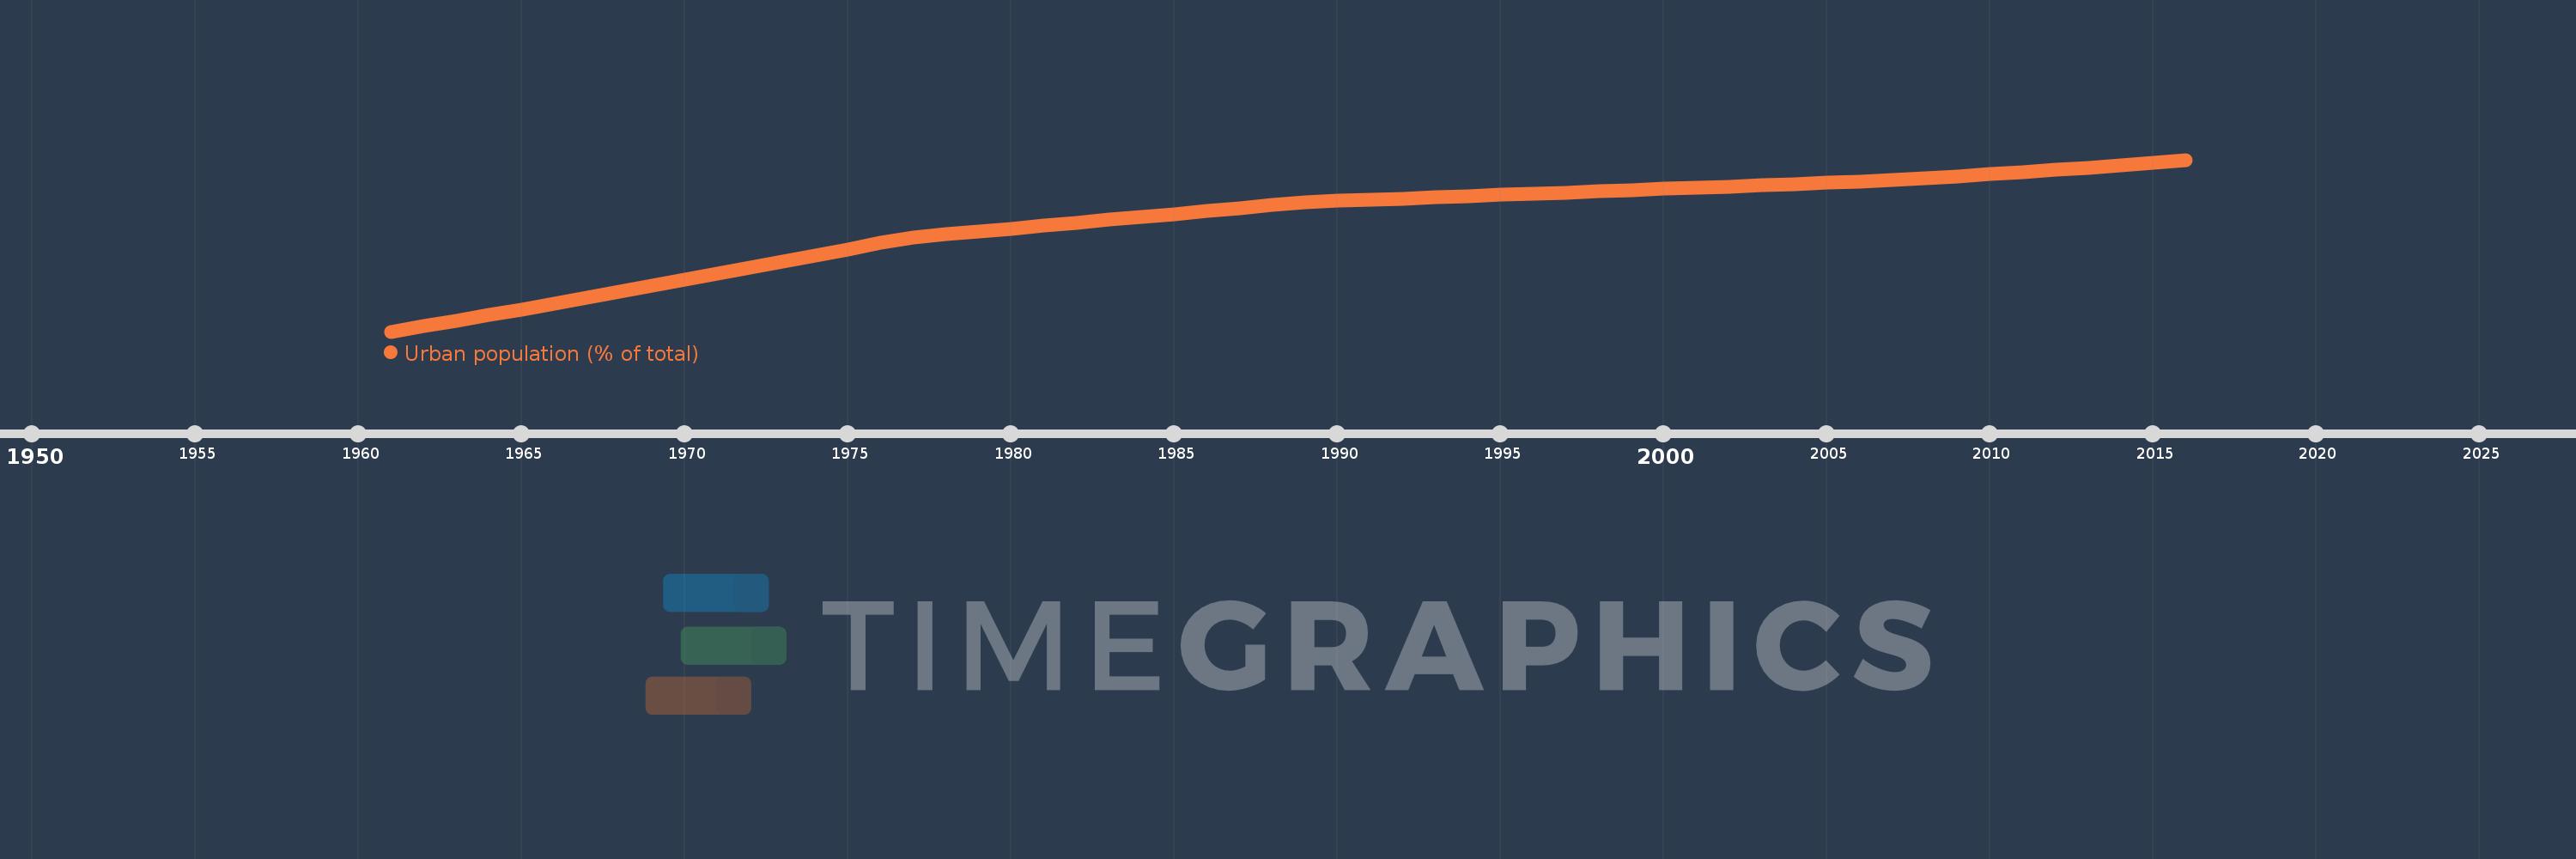
Urban population (% of total)
2016,2015,2014,2013,2012,2011,2010,2009,2008,2007,2006,2005,2004,2003,2002,2001,2000,1999,1998,1997,1996,1995,1994,1993,1992,1991,1990,1989,1988,1987,1986,1985,1984,1983,1982,1981,1980,1979,1978,1977,1976,1975,1974,1973,1972,1971,1970,1969,1968,1967,1966,1965,1964,1963,1962,1961
This statistics in other country:
AfghanistanAlbaniaAlgeriaAmerican SamoaAndorraAngolaAntigua and BarbudaArab WorldArgentinaArmeniaArubaAustraliaAustriaAzerbaijanBahamas, TheBahrainBangladeshBarbadosBelarusBelgiumBelizeBeninBermudaBhutanBoliviaBosnia and HerzegovinaBotswanaBrazilBritish Virgin IslandsBrunei DarussalamBulgariaBurkina FasoBurundiCabo VerdeCambodiaCameroonCanadaCaribbean small statesCayman IslandsCentral African RepublicCentral Europe and the BalticsChadChannel IslandsChileChinaColombiaComorosCongo, Dem. Rep.Congo, Rep.Costa RicaCote d'IvoireCroatiaCubaCuracaoCyprusCzech RepublicDenmarkDjiboutiDominicaDominican RepublicEarly-demographic dividendEast Asia & PacificEast Asia & Pacific (excluding high income)East Asia & Pacific (IDA & IBRD countries)EcuadorEgypt, Arab Rep.El SalvadorEquatorial GuineaEritreaEstoniaEthiopiaEuro areaEurope & Central AsiaEurope & Central Asia (excluding high income)Europe & Central Asia (IDA & IBRD countries)European UnionFaroe IslandsFijiFinlandFragile and conflict affected situationsFranceFrench PolynesiaGabonGambia, TheGeorgiaGermanyGhanaGibraltarGreeceGreenlandGrenadaGuamGuatemalaGuineaGuinea-BissauGuyanaHaitiHeavily indebted poor countries (HIPC)High incomeHondurasHong Kong SAR, ChinaHungaryIBRD onlyIcelandIDA & IBRD totalIDA blendIDA onlyIDA totalIndiaIndonesiaIran, Islamic Rep.IraqIrelandIsle of ManIsraelItalyJamaicaJapanJordanKazakhstanKenyaKiribatiKorea, Dem. People’s Rep.Korea, Rep.KuwaitKyrgyz RepublicLao PDRLate-demographic dividendLatin America & Caribbean Latin America & Caribbean (excluding high income)Latin America & the Caribbean (IDA & IBRD countries)LatviaLeast developed countries: UN classificationLebanonLesothoLiberiaLibyaLiechtensteinLithuaniaLow & middle incomeLow incomeLower middle incomeLuxembourgMacao SAR, ChinaMacedonia, FYRMadagascarMalawiMalaysiaMaldivesMaliMaltaMarshall IslandsMauritaniaMauritiusMexicoMicronesia, Fed. Sts.Middle East & North AfricaMiddle East & North Africa (excluding high income)Middle East & North Africa (IDA & IBRD countries)Middle incomeMoldovaMonacoMongoliaMontenegroMoroccoMozambiqueMyanmarNamibiaNauruNepalNetherlandsNew CaledoniaNew ZealandNicaraguaNigerNigeriaNorth AmericaNorthern Mariana IslandsNorwayOECD membersOmanOther small statesPacific island small statesPakistanPalauPanamaPapua New GuineaParaguayPeruPhilippinesPolandPortugalPost-demographic dividendPre-demographic dividendPuerto RicoQatarRomaniaRussian FederationRwandaSamoaSan MarinoSao Tome and PrincipeSaudi ArabiaSenegalSerbiaSeychellesSierra LeoneSingaporeSint Maarten (Dutch part)Slovak RepublicSloveniaSmall statesSolomon IslandsSomaliaSouth AfricaSouth AsiaSouth Asia (IDA & IBRD)South SudanSpainSri LankaSt. Kitts and NevisSt. LuciaSt. Vincent and the GrenadinesSub-Saharan Africa Sub-Saharan Africa (excluding high income)Sub-Saharan Africa (IDA & IBRD countries)SudanSurinameSwazilandSwedenSwitzerlandSyrian Arab RepublicTajikistanTanzaniaThailandTimor-LesteTogoTongaTrinidad and TobagoTunisiaTurkeyTurkmenistanTurks and Caicos IslandsTuvaluUgandaUkraineUnited Arab EmiratesUnited KingdomUnited StatesUpper middle incomeUruguayUzbekistanVanuatuVenezuela, RBVietnamVirgin Islands (U.S.)West Bank and GazaWorldYemen, Rep.ZambiaZimbabwe Timeline:
This timeline shows a graph from 1961 to 2016 of Senegal. No data until 1960. Number of actual observations by date: 56.
Source name:
World Development Indicators
Source organization:
United Nations, World Urbanization Prospects.
Categories, topics:
Climate Change, Urban Development
Last updated:
apr 23, 2017
Indicators value changes by year
Maximum:
43.721
jan 1, 2016
At the date of observation
Value
Absolute change
Change from previous value
jan 1, 1961
23.0
+23.0
0.0%
jan 1, 1962
23.645
+0.645
2.8%
jan 1, 1963
24.303
+0.658
2.78%
jan 1, 1964
24.973
+0.67
2.76%
jan 1, 1965
25.657
+0.684
2.74%
jan 1, 1966
26.351
+0.694
2.7%
jan 1, 1967
27.057
+0.706
2.68%
jan 1, 1968
27.776
+0.719
2.66%
jan 1, 1969
28.507
+0.731
2.63%
jan 1, 1970
29.247
+0.74
2.6%
jan 1, 1971
30.0
+0.753
2.57%
jan 1, 1972
30.72
+0.72
2.4%
jan 1, 1973
31.451
+0.731
2.38%
jan 1, 1974
32.189
+0.738
2.35%
jan 1, 1975
32.937
+0.748
2.32%
jan 1, 1976
33.693
+0.756
2.3%
jan 1, 1977
34.372
+0.679
2.02%
jan 1, 1978
34.718
+0.346
1.01%
jan 1, 1979
35.067
+0.349
1.01%
jan 1, 1980
35.417
+0.35
1.0%
jan 1, 1981
35.769
+0.352
0.99%
jan 1, 1982
36.122
+0.353
0.99%
jan 1, 1983
36.476
+0.354
0.98%
jan 1, 1984
36.832
+0.356
0.98%
jan 1, 1985
37.191
+0.359
0.97%
jan 1, 1986
37.549
+0.358
0.96%
jan 1, 1987
37.909
+0.36
0.96%
jan 1, 1988
38.271
+0.362
0.95%
jan 1, 1989
38.614
+0.343
0.9%
jan 1, 1990
38.757
+0.143
0.37%
jan 1, 1991
38.9
+0.143
0.37%
jan 1, 1992
39.044
+0.144
0.37%
jan 1, 1993
39.188
+0.144
0.37%
jan 1, 1994
39.332
+0.144
0.37%
jan 1, 1995
39.476
+0.144
0.37%
jan 1, 1996
39.62
+0.144
0.36%
jan 1, 1997
39.765
+0.145
0.37%
jan 1, 1998
39.91
+0.145
0.36%
jan 1, 1999
40.055
+0.145
0.36%
jan 1, 2000
40.2
+0.145
0.36%
jan 1, 2001
40.345
+0.145
0.36%
jan 1, 2002
40.49
+0.145
0.36%
jan 1, 2003
40.636
+0.146
0.36%
jan 1, 2004
40.782
+0.146
0.36%
jan 1, 2005
40.943
+0.161
0.39%
jan 1, 2006
41.119
+0.176
0.43%
jan 1, 2007
41.311
+0.192
0.47%
jan 1, 2008
41.518
+0.207
0.5%
jan 1, 2009
41.74
+0.222
0.53%
jan 1, 2010
41.977
+0.237
0.57%
jan 1, 2011
42.23
+0.253
0.6%
jan 1, 2012
42.497
+0.267
0.63%
jan 1, 2013
42.781
+0.284
0.67%
jan 1, 2014
43.079
+0.298
0.7%
jan 1, 2015
43.393
+0.314
0.73%
jan 1, 2016
43.721
+0.328
0.76%
Ranking of countries by current statistics by years


Comments: