29
/
en
AIzaSyAYiBZKx7MnpbEhh9jyipgxe19OcubqV5w
April 1, 2024
32326
Europe & Central Asia (excluding high income)
ECA
false
2
1
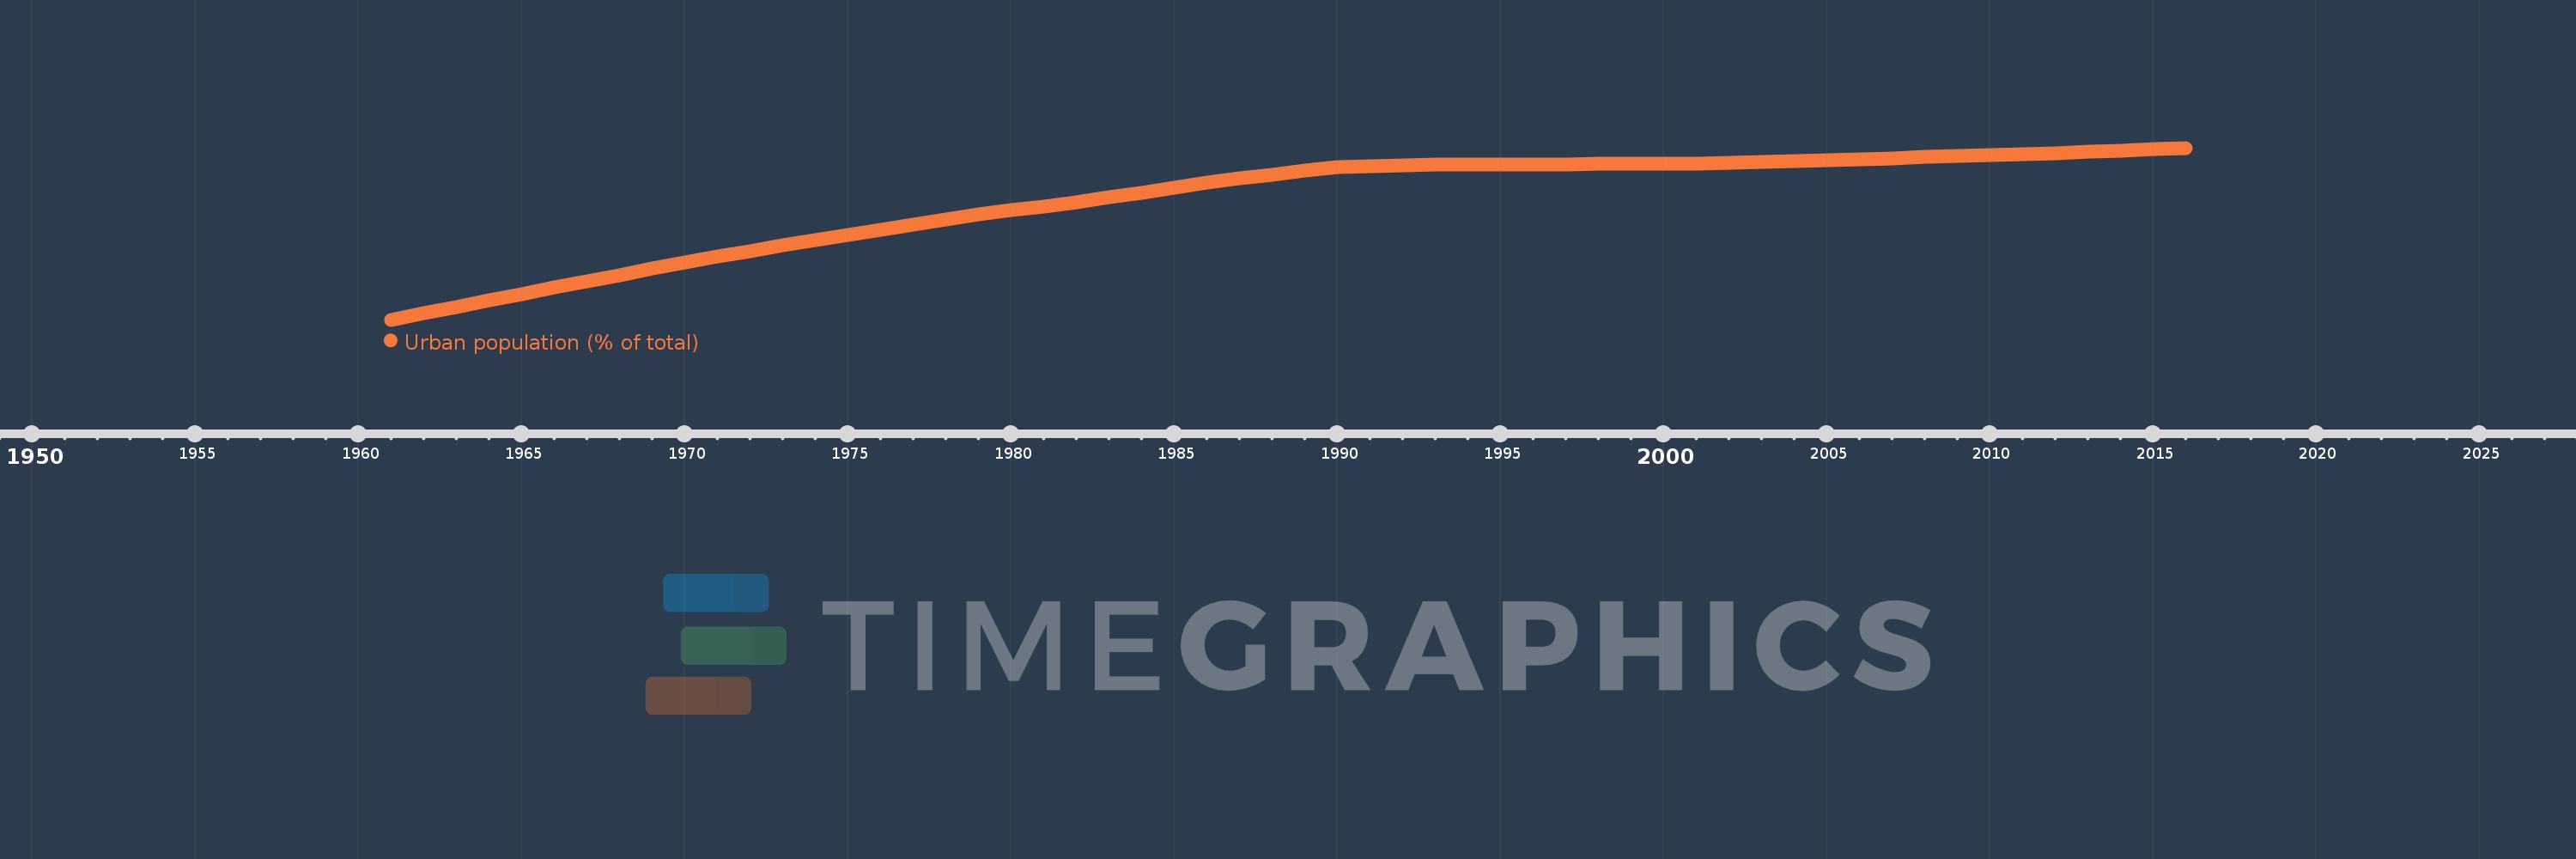
Urban population (% of total)
2016,2015,2014,2013,2012,2011,2010,2009,2008,2007,2006,2005,2004,2003,2002,2001,2000,1999,1998,1997,1996,1995,1994,1993,1992,1991,1990,1989,1988,1987,1986,1985,1984,1983,1982,1981,1980,1979,1978,1977,1976,1975,1974,1973,1972,1971,1970,1969,1968,1967,1966,1965,1964,1963,1962,1961
This statistics in other country:
AfghanistanAlbaniaAlgeriaAmerican SamoaAndorraAngolaAntigua and BarbudaArab WorldArgentinaArmeniaArubaAustraliaAustriaAzerbaijanBahamas, TheBahrainBangladeshBarbadosBelarusBelgiumBelizeBeninBermudaBhutanBoliviaBosnia and HerzegovinaBotswanaBrazilBritish Virgin IslandsBrunei DarussalamBulgariaBurkina FasoBurundiCabo VerdeCambodiaCameroonCanadaCaribbean small statesCayman IslandsCentral African RepublicCentral Europe and the BalticsChadChannel IslandsChileChinaColombiaComorosCongo, Dem. Rep.Congo, Rep.Costa RicaCote d'IvoireCroatiaCubaCuracaoCyprusCzech RepublicDenmarkDjiboutiDominicaDominican RepublicEarly-demographic dividendEast Asia & PacificEast Asia & Pacific (excluding high income)East Asia & Pacific (IDA & IBRD countries)EcuadorEgypt, Arab Rep.El SalvadorEquatorial GuineaEritreaEstoniaEthiopiaEuro areaEurope & Central AsiaEurope & Central Asia (excluding high income)Europe & Central Asia (IDA & IBRD countries)European UnionFaroe IslandsFijiFinlandFragile and conflict affected situationsFranceFrench PolynesiaGabonGambia, TheGeorgiaGermanyGhanaGibraltarGreeceGreenlandGrenadaGuamGuatemalaGuineaGuinea-BissauGuyanaHaitiHeavily indebted poor countries (HIPC)High incomeHondurasHong Kong SAR, ChinaHungaryIBRD onlyIcelandIDA & IBRD totalIDA blendIDA onlyIDA totalIndiaIndonesiaIran, Islamic Rep.IraqIrelandIsle of ManIsraelItalyJamaicaJapanJordanKazakhstanKenyaKiribatiKorea, Dem. People’s Rep.Korea, Rep.KuwaitKyrgyz RepublicLao PDRLate-demographic dividendLatin America & Caribbean Latin America & Caribbean (excluding high income)Latin America & the Caribbean (IDA & IBRD countries)LatviaLeast developed countries: UN classificationLebanonLesothoLiberiaLibyaLiechtensteinLithuaniaLow & middle incomeLow incomeLower middle incomeLuxembourgMacao SAR, ChinaMacedonia, FYRMadagascarMalawiMalaysiaMaldivesMaliMaltaMarshall IslandsMauritaniaMauritiusMexicoMicronesia, Fed. Sts.Middle East & North AfricaMiddle East & North Africa (excluding high income)Middle East & North Africa (IDA & IBRD countries)Middle incomeMoldovaMonacoMongoliaMontenegroMoroccoMozambiqueMyanmarNamibiaNauruNepalNetherlandsNew CaledoniaNew ZealandNicaraguaNigerNigeriaNorth AmericaNorthern Mariana IslandsNorwayOECD membersOmanOther small statesPacific island small statesPakistanPalauPanamaPapua New GuineaParaguayPeruPhilippinesPolandPortugalPost-demographic dividendPre-demographic dividendPuerto RicoQatarRomaniaRussian FederationRwandaSamoaSan MarinoSao Tome and PrincipeSaudi ArabiaSenegalSerbiaSeychellesSierra LeoneSingaporeSint Maarten (Dutch part)Slovak RepublicSloveniaSmall statesSolomon IslandsSomaliaSouth AfricaSouth AsiaSouth Asia (IDA & IBRD)South SudanSpainSri LankaSt. Kitts and NevisSt. LuciaSt. Vincent and the GrenadinesSub-Saharan Africa Sub-Saharan Africa (excluding high income)Sub-Saharan Africa (IDA & IBRD countries)SudanSurinameSwazilandSwedenSwitzerlandSyrian Arab RepublicTajikistanTanzaniaThailandTimor-LesteTogoTongaTrinidad and TobagoTunisiaTurkeyTurkmenistanTurks and Caicos IslandsTuvaluUgandaUkraineUnited Arab EmiratesUnited KingdomUnited StatesUpper middle incomeUruguayUzbekistanVanuatuVenezuela, RBVietnamVirgin Islands (U.S.)West Bank and GazaWorldYemen, Rep.ZambiaZimbabwe Timeline:
This timeline shows a graph from 1961 to 2016 of Europe & Central Asia (excluding high income). No data until 1960. Number of actual observations by date: 56.
Source name:
World Development Indicators
Source organization:
United Nations, World Urbanization Prospects.
Categories, topics:
Climate Change, Urban Development
Last updated:
apr 23, 2017
Indicators value changes by year
Minimum:
44.913
jan 1, 1961
Maximum:
65.086
jan 1, 2016
At the date of observation
Value
Absolute change
Change from previous value
jan 1, 1961
44.913
+44.913
0.0%
jan 1, 1962
45.665
+0.752
1.67%
jan 1, 1963
46.416
+0.751
1.64%
jan 1, 1964
47.167
+0.751
1.62%
jan 1, 1965
47.917
+0.75
1.59%
jan 1, 1966
48.682
+0.764
1.6%
jan 1, 1967
49.425
+0.744
1.53%
jan 1, 1968
50.155
+0.73
1.48%
jan 1, 1969
50.886
+0.73
1.46%
jan 1, 1970
51.612
+0.727
1.43%
jan 1, 1971
52.326
+0.714
1.38%
jan 1, 1972
52.996
+0.669
1.28%
jan 1, 1973
53.638
+0.642
1.21%
jan 1, 1974
54.277
+0.639
1.19%
jan 1, 1975
54.91
+0.633
1.17%
jan 1, 1976
55.516
+0.607
1.11%
jan 1, 1977
56.104
+0.588
1.06%
jan 1, 1978
56.684
+0.58
1.03%
jan 1, 1979
57.267
+0.582
1.03%
jan 1, 1980
57.775
+0.508
0.89%
jan 1, 1981
58.194
+0.42
0.73%
jan 1, 1982
58.718
+0.523
0.9%
jan 1, 1983
59.282
+0.564
0.96%
jan 1, 1984
59.847
+0.565
0.95%
jan 1, 1985
60.421
+0.575
0.96%
jan 1, 1986
60.979
+0.558
0.92%
jan 1, 1987
61.488
+0.509
0.83%
jan 1, 1988
61.974
+0.485
0.79%
jan 1, 1989
62.458
+0.484
0.78%
jan 1, 1990
62.789
+0.332
0.53%
jan 1, 1991
62.96
+0.17
0.27%
jan 1, 1992
63.064
+0.104
0.17%
jan 1, 1993
63.105
+0.041
0.06%
jan 1, 1994
63.115
+0.01
0.02%
jan 1, 1995
63.13
+0.016
0.02%
jan 1, 1996
63.158
+0.028
0.04%
jan 1, 1997
63.172
+0.014
0.02%
jan 1, 1998
63.192
+0.019
0.03%
jan 1, 1999
63.219
+0.028
0.04%
jan 1, 2000
63.251
+0.031
0.05%
jan 1, 2001
63.282
+0.031
0.05%
jan 1, 2002
63.338
+0.056
0.09%
jan 1, 2003
63.419
+0.082
0.13%
jan 1, 2004
63.531
+0.112
0.18%
jan 1, 2005
63.65
+0.119
0.19%
jan 1, 2006
63.77
+0.121
0.19%
jan 1, 2007
63.889
+0.119
0.19%
jan 1, 2008
64.015
+0.125
0.2%
jan 1, 2009
64.138
+0.123
0.19%
jan 1, 2010
64.252
+0.114
0.18%
jan 1, 2011
64.357
+0.105
0.16%
jan 1, 2012
64.47
+0.113
0.18%
jan 1, 2013
64.617
+0.147
0.23%
jan 1, 2014
64.771
+0.154
0.24%
jan 1, 2015
64.927
+0.157
0.24%
jan 1, 2016
65.086
+0.159
0.24%
Ranking of countries by current statistics by years


Comments: