29
/
en
AIzaSyAYiBZKx7MnpbEhh9jyipgxe19OcubqV5w
April 1, 2024
246455
South Africa
ZAF
true
2
1
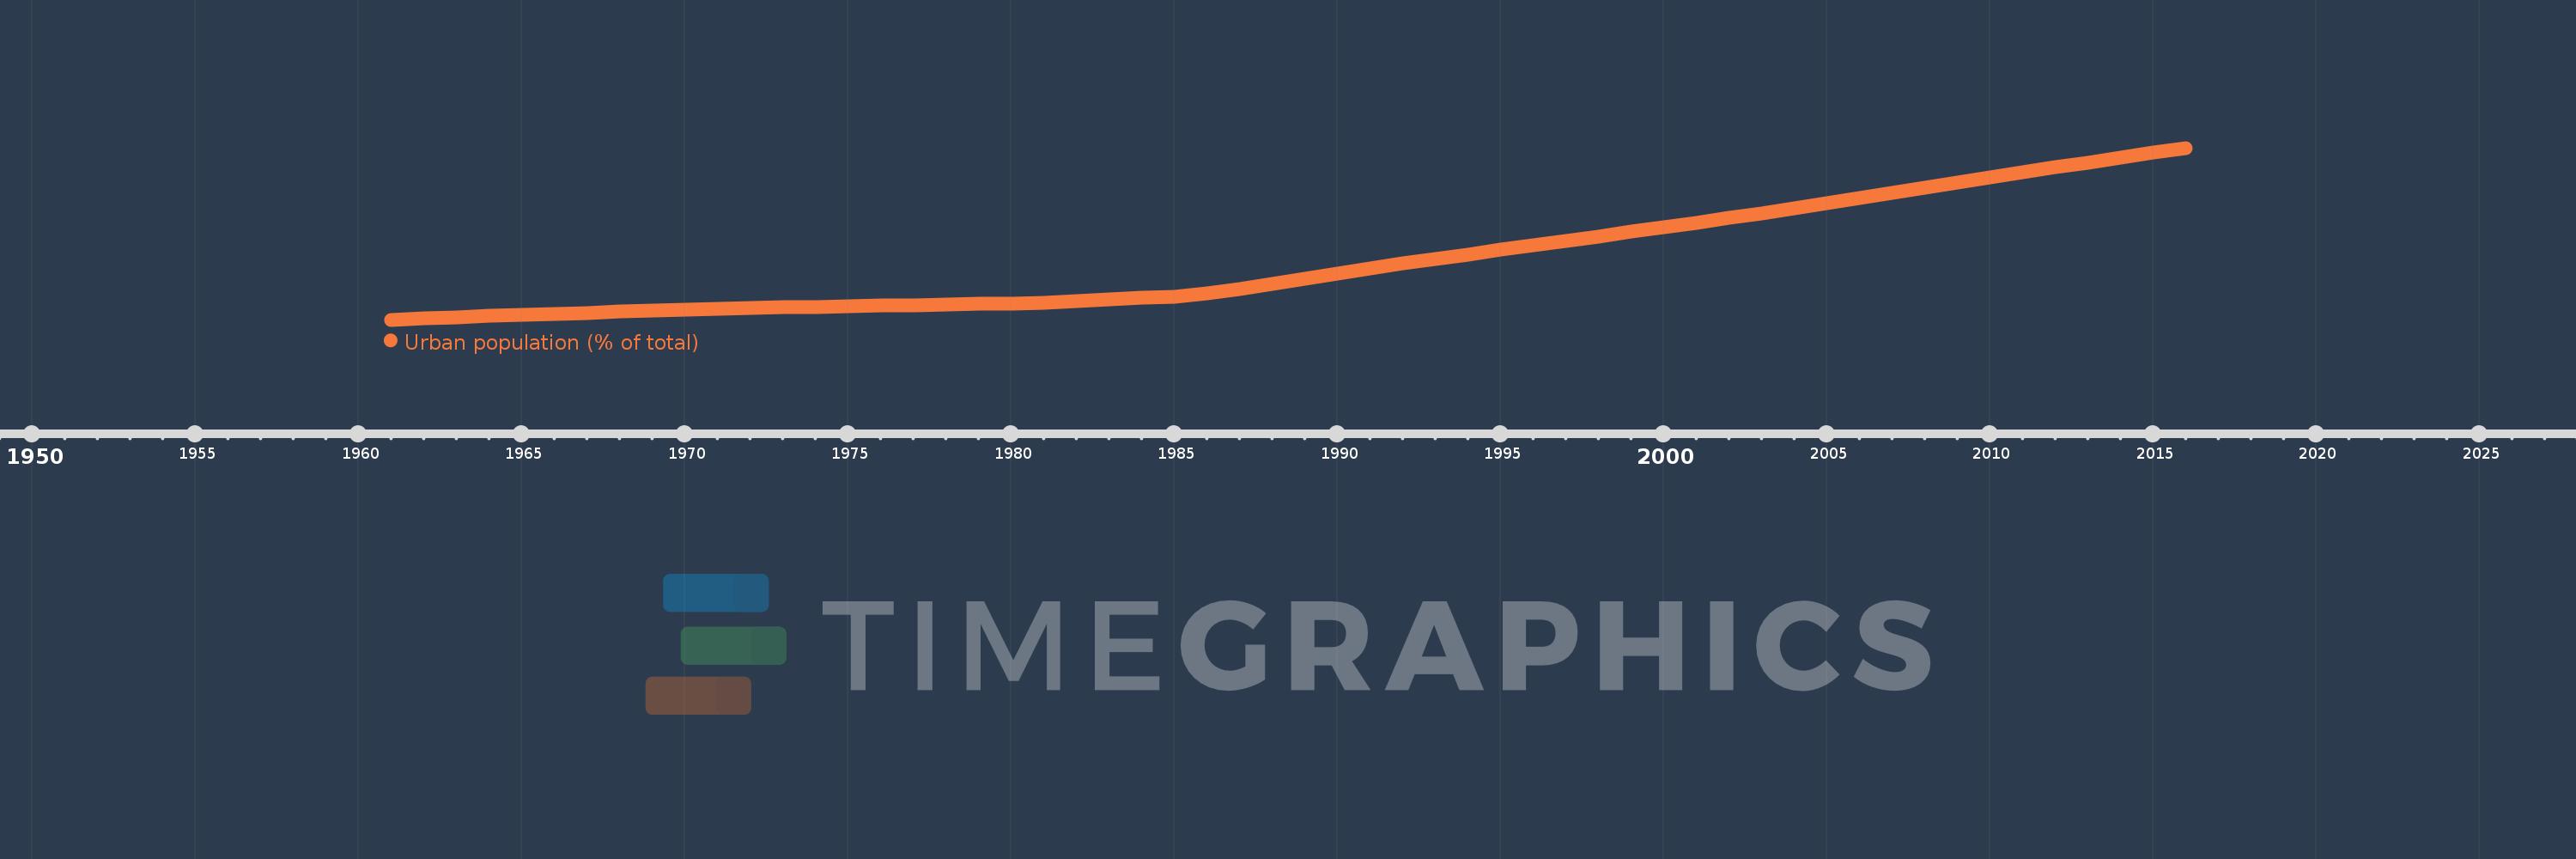
Urban population (% of total)
2016,2015,2014,2013,2012,2011,2010,2009,2008,2007,2006,2005,2004,2003,2002,2001,2000,1999,1998,1997,1996,1995,1994,1993,1992,1991,1990,1989,1988,1987,1986,1985,1984,1983,1982,1981,1980,1979,1978,1977,1976,1975,1974,1973,1972,1971,1970,1969,1968,1967,1966,1965,1964,1963,1962,1961
This statistics in other country:
AfghanistanAlbaniaAlgeriaAmerican SamoaAndorraAngolaAntigua and BarbudaArab WorldArgentinaArmeniaArubaAustraliaAustriaAzerbaijanBahamas, TheBahrainBangladeshBarbadosBelarusBelgiumBelizeBeninBermudaBhutanBoliviaBosnia and HerzegovinaBotswanaBrazilBritish Virgin IslandsBrunei DarussalamBulgariaBurkina FasoBurundiCabo VerdeCambodiaCameroonCanadaCaribbean small statesCayman IslandsCentral African RepublicCentral Europe and the BalticsChadChannel IslandsChileChinaColombiaComorosCongo, Dem. Rep.Congo, Rep.Costa RicaCote d'IvoireCroatiaCubaCuracaoCyprusCzech RepublicDenmarkDjiboutiDominicaDominican RepublicEarly-demographic dividendEast Asia & PacificEast Asia & Pacific (excluding high income)East Asia & Pacific (IDA & IBRD countries)EcuadorEgypt, Arab Rep.El SalvadorEquatorial GuineaEritreaEstoniaEthiopiaEuro areaEurope & Central AsiaEurope & Central Asia (excluding high income)Europe & Central Asia (IDA & IBRD countries)European UnionFaroe IslandsFijiFinlandFragile and conflict affected situationsFranceFrench PolynesiaGabonGambia, TheGeorgiaGermanyGhanaGibraltarGreeceGreenlandGrenadaGuamGuatemalaGuineaGuinea-BissauGuyanaHaitiHeavily indebted poor countries (HIPC)High incomeHondurasHong Kong SAR, ChinaHungaryIBRD onlyIcelandIDA & IBRD totalIDA blendIDA onlyIDA totalIndiaIndonesiaIran, Islamic Rep.IraqIrelandIsle of ManIsraelItalyJamaicaJapanJordanKazakhstanKenyaKiribatiKorea, Dem. People’s Rep.Korea, Rep.KuwaitKyrgyz RepublicLao PDRLate-demographic dividendLatin America & Caribbean Latin America & Caribbean (excluding high income)Latin America & the Caribbean (IDA & IBRD countries)LatviaLeast developed countries: UN classificationLebanonLesothoLiberiaLibyaLiechtensteinLithuaniaLow & middle incomeLow incomeLower middle incomeLuxembourgMacao SAR, ChinaMacedonia, FYRMadagascarMalawiMalaysiaMaldivesMaliMaltaMarshall IslandsMauritaniaMauritiusMexicoMicronesia, Fed. Sts.Middle East & North AfricaMiddle East & North Africa (excluding high income)Middle East & North Africa (IDA & IBRD countries)Middle incomeMoldovaMonacoMongoliaMontenegroMoroccoMozambiqueMyanmarNamibiaNauruNepalNetherlandsNew CaledoniaNew ZealandNicaraguaNigerNigeriaNorth AmericaNorthern Mariana IslandsNorwayOECD membersOmanOther small statesPacific island small statesPakistanPalauPanamaPapua New GuineaParaguayPeruPhilippinesPolandPortugalPost-demographic dividendPre-demographic dividendPuerto RicoQatarRomaniaRussian FederationRwandaSamoaSan MarinoSao Tome and PrincipeSaudi ArabiaSenegalSerbiaSeychellesSierra LeoneSingaporeSint Maarten (Dutch part)Slovak RepublicSloveniaSmall statesSolomon IslandsSomaliaSouth AfricaSouth AsiaSouth Asia (IDA & IBRD)South SudanSpainSri LankaSt. Kitts and NevisSt. LuciaSt. Vincent and the GrenadinesSub-Saharan Africa Sub-Saharan Africa (excluding high income)Sub-Saharan Africa (IDA & IBRD countries)SudanSurinameSwazilandSwedenSwitzerlandSyrian Arab RepublicTajikistanTanzaniaThailandTimor-LesteTogoTongaTrinidad and TobagoTunisiaTurkeyTurkmenistanTurks and Caicos IslandsTuvaluUgandaUkraineUnited Arab EmiratesUnited KingdomUnited StatesUpper middle incomeUruguayUzbekistanVanuatuVenezuela, RBVietnamVirgin Islands (U.S.)West Bank and GazaWorldYemen, Rep.ZambiaZimbabwe Timeline:
This timeline shows a graph from 1961 to 2016 of South Africa. No data until 1960. Number of actual observations by date: 56.
Source name:
World Development Indicators
Source organization:
United Nations, World Urbanization Prospects.
Categories, topics:
Climate Change, Urban Development
Last updated:
apr 23, 2017
Indicators value changes by year
Minimum:
46.619
jan 1, 1961
Maximum:
64.801
jan 1, 2016
At the date of observation
Value
Absolute change
Change from previous value
jan 1, 1961
46.619
+46.619
0.0%
jan 1, 1962
46.793
+0.174
0.37%
jan 1, 1963
46.906
+0.113
0.24%
jan 1, 1964
47.02
+0.114
0.24%
jan 1, 1965
47.134
+0.114
0.24%
jan 1, 1966
47.248
+0.114
0.24%
jan 1, 1967
47.362
+0.114
0.24%
jan 1, 1968
47.476
+0.114
0.24%
jan 1, 1969
47.59
+0.114
0.24%
jan 1, 1970
47.704
+0.114
0.24%
jan 1, 1971
47.809
+0.105
0.22%
jan 1, 1972
47.869
+0.06
0.13%
jan 1, 1973
47.929
+0.06
0.13%
jan 1, 1974
47.989
+0.06
0.13%
jan 1, 1975
48.049
+0.06
0.13%
jan 1, 1976
48.109
+0.06
0.12%
jan 1, 1977
48.169
+0.06
0.12%
jan 1, 1978
48.229
+0.06
0.12%
jan 1, 1979
48.289
+0.06
0.12%
jan 1, 1980
48.349
+0.06
0.12%
jan 1, 1981
48.425
+0.076
0.16%
jan 1, 1982
48.591
+0.166
0.34%
jan 1, 1983
48.756
+0.165
0.34%
jan 1, 1984
48.922
+0.166
0.34%
jan 1, 1985
49.088
+0.166
0.34%
jan 1, 1986
49.372
+0.284
0.58%
jan 1, 1987
49.905
+0.533
1.08%
jan 1, 1988
50.439
+0.534
1.07%
jan 1, 1989
50.972
+0.533
1.06%
jan 1, 1990
51.505
+0.533
1.05%
jan 1, 1991
52.037
+0.532
1.03%
jan 1, 1992
52.554
+0.517
0.99%
jan 1, 1993
53.038
+0.484
0.92%
jan 1, 1994
53.521
+0.483
0.91%
jan 1, 1995
54.004
+0.483
0.9%
jan 1, 1996
54.486
+0.482
0.89%
jan 1, 1997
54.967
+0.481
0.88%
jan 1, 1998
55.449
+0.482
0.88%
jan 1, 1999
55.93
+0.481
0.87%
jan 1, 2000
56.411
+0.481
0.86%
jan 1, 2001
56.891
+0.48
0.85%
jan 1, 2002
57.368
+0.477
0.84%
jan 1, 2003
57.898
+0.53
0.92%
jan 1, 2004
58.446
+0.548
0.95%
jan 1, 2005
58.993
+0.547
0.94%
jan 1, 2006
59.536
+0.543
0.92%
jan 1, 2007
60.077
+0.541
0.91%
jan 1, 2008
60.616
+0.539
0.9%
jan 1, 2009
61.154
+0.538
0.89%
jan 1, 2010
61.687
+0.533
0.87%
jan 1, 2011
62.218
+0.531
0.86%
jan 1, 2012
62.746
+0.528
0.85%
jan 1, 2013
63.272
+0.526
0.84%
jan 1, 2014
63.788
+0.516
0.82%
jan 1, 2015
64.298
+0.51
0.8%
jan 1, 2016
64.801
+0.503
0.78%
Ranking of countries by current statistics by years


Comments: