29
/
en
AIzaSyAYiBZKx7MnpbEhh9jyipgxe19OcubqV5w
April 1, 2024
160148
Isle of Man
IMN
true
2
1
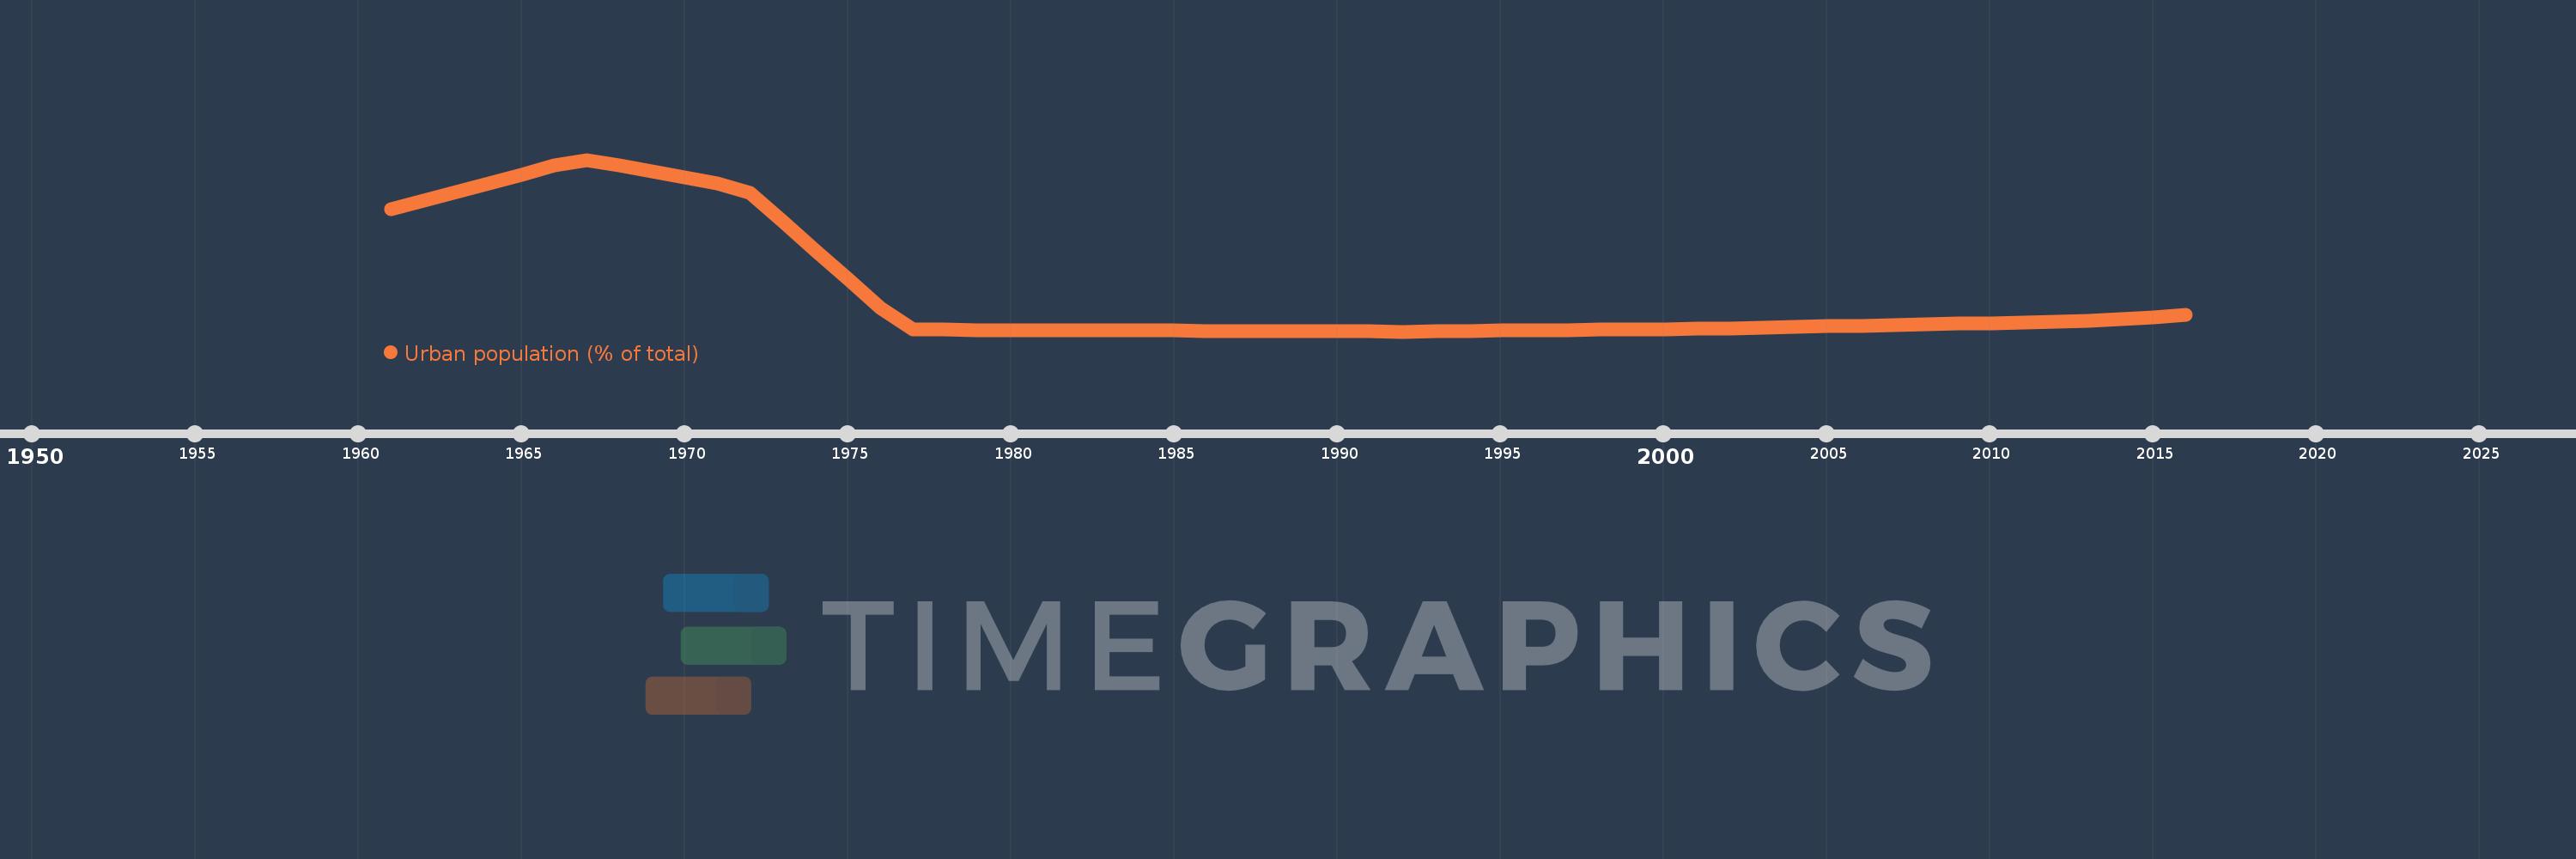
Urban population (% of total)
2016,2015,2014,2013,2012,2011,2010,2009,2008,2007,2006,2005,2004,2003,2002,2001,2000,1999,1998,1997,1996,1995,1994,1993,1992,1991,1990,1989,1988,1987,1986,1985,1984,1983,1982,1981,1980,1979,1978,1977,1976,1975,1974,1973,1972,1971,1970,1969,1968,1967,1966,1965,1964,1963,1962,1961
This statistics in other country:
AfghanistanAlbaniaAlgeriaAmerican SamoaAndorraAngolaAntigua and BarbudaArab WorldArgentinaArmeniaArubaAustraliaAustriaAzerbaijanBahamas, TheBahrainBangladeshBarbadosBelarusBelgiumBelizeBeninBermudaBhutanBoliviaBosnia and HerzegovinaBotswanaBrazilBritish Virgin IslandsBrunei DarussalamBulgariaBurkina FasoBurundiCabo VerdeCambodiaCameroonCanadaCaribbean small statesCayman IslandsCentral African RepublicCentral Europe and the BalticsChadChannel IslandsChileChinaColombiaComorosCongo, Dem. Rep.Congo, Rep.Costa RicaCote d'IvoireCroatiaCubaCuracaoCyprusCzech RepublicDenmarkDjiboutiDominicaDominican RepublicEarly-demographic dividendEast Asia & PacificEast Asia & Pacific (excluding high income)East Asia & Pacific (IDA & IBRD countries)EcuadorEgypt, Arab Rep.El SalvadorEquatorial GuineaEritreaEstoniaEthiopiaEuro areaEurope & Central AsiaEurope & Central Asia (excluding high income)Europe & Central Asia (IDA & IBRD countries)European UnionFaroe IslandsFijiFinlandFragile and conflict affected situationsFranceFrench PolynesiaGabonGambia, TheGeorgiaGermanyGhanaGibraltarGreeceGreenlandGrenadaGuamGuatemalaGuineaGuinea-BissauGuyanaHaitiHeavily indebted poor countries (HIPC)High incomeHondurasHong Kong SAR, ChinaHungaryIBRD onlyIcelandIDA & IBRD totalIDA blendIDA onlyIDA totalIndiaIndonesiaIran, Islamic Rep.IraqIrelandIsle of ManIsraelItalyJamaicaJapanJordanKazakhstanKenyaKiribatiKorea, Dem. People’s Rep.Korea, Rep.KuwaitKyrgyz RepublicLao PDRLate-demographic dividendLatin America & Caribbean Latin America & Caribbean (excluding high income)Latin America & the Caribbean (IDA & IBRD countries)LatviaLeast developed countries: UN classificationLebanonLesothoLiberiaLibyaLiechtensteinLithuaniaLow & middle incomeLow incomeLower middle incomeLuxembourgMacao SAR, ChinaMacedonia, FYRMadagascarMalawiMalaysiaMaldivesMaliMaltaMarshall IslandsMauritaniaMauritiusMexicoMicronesia, Fed. Sts.Middle East & North AfricaMiddle East & North Africa (excluding high income)Middle East & North Africa (IDA & IBRD countries)Middle incomeMoldovaMonacoMongoliaMontenegroMoroccoMozambiqueMyanmarNamibiaNauruNepalNetherlandsNew CaledoniaNew ZealandNicaraguaNigerNigeriaNorth AmericaNorthern Mariana IslandsNorwayOECD membersOmanOther small statesPacific island small statesPakistanPalauPanamaPapua New GuineaParaguayPeruPhilippinesPolandPortugalPost-demographic dividendPre-demographic dividendPuerto RicoQatarRomaniaRussian FederationRwandaSamoaSan MarinoSao Tome and PrincipeSaudi ArabiaSenegalSerbiaSeychellesSierra LeoneSingaporeSint Maarten (Dutch part)Slovak RepublicSloveniaSmall statesSolomon IslandsSomaliaSouth AfricaSouth AsiaSouth Asia (IDA & IBRD)South SudanSpainSri LankaSt. Kitts and NevisSt. LuciaSt. Vincent and the GrenadinesSub-Saharan Africa Sub-Saharan Africa (excluding high income)Sub-Saharan Africa (IDA & IBRD countries)SudanSurinameSwazilandSwedenSwitzerlandSyrian Arab RepublicTajikistanTanzaniaThailandTimor-LesteTogoTongaTrinidad and TobagoTunisiaTurkeyTurkmenistanTurks and Caicos IslandsTuvaluUgandaUkraineUnited Arab EmiratesUnited KingdomUnited StatesUpper middle incomeUruguayUzbekistanVanuatuVenezuela, RBVietnamVirgin Islands (U.S.)West Bank and GazaWorldYemen, Rep.ZambiaZimbabwe Timeline:
This timeline shows a graph from 1961 to 2016 of Isle of Man. No data until 1960. Number of actual observations by date: 56.
Source name:
World Development Indicators
Source organization:
United Nations, World Urbanization Prospects.
Categories, topics:
Climate Change, Urban Development
Last updated:
apr 23, 2017
Indicators value changes by year
Minimum:
51.745
jan 1, 1992
At the date of observation
Value
Absolute change
Change from previous value
jan 1, 1961
55.123
+55.123
0.0%
jan 1, 1962
55.345
+0.222
0.4%
jan 1, 1963
55.586
+0.241
0.44%
jan 1, 1964
55.826
+0.24
0.43%
jan 1, 1965
56.066
+0.24
0.43%
jan 1, 1966
56.305
+0.239
0.43%
jan 1, 1967
56.47
+0.165
0.29%
jan 1, 1968
56.311
-0.159
-0.28%
jan 1, 1969
56.151
-0.16
-0.28%
jan 1, 1970
55.991
-0.16
-0.28%
jan 1, 1971
55.831
-0.16
-0.29%
jan 1, 1972
55.556
-0.275
-0.49%
jan 1, 1973
54.77
-0.786
-1.41%
jan 1, 1974
53.983
-0.787
-1.44%
jan 1, 1975
53.194
-0.789
-1.46%
jan 1, 1976
52.403
-0.791
-1.49%
jan 1, 1977
51.799
-0.604
-1.15%
jan 1, 1978
51.795
-0.004
-0.01%
jan 1, 1979
51.791
-0.004
-0.01%
jan 1, 1980
51.788
-0.003
-0.01%
jan 1, 1981
51.784
-0.004
-0.01%
jan 1, 1982
51.78
-0.004
-0.01%
jan 1, 1983
51.776
-0.004
-0.01%
jan 1, 1984
51.773
-0.003
-0.01%
jan 1, 1985
51.769
-0.004
-0.01%
jan 1, 1986
51.765
-0.004
-0.01%
jan 1, 1987
51.761
-0.004
-0.01%
jan 1, 1988
51.757
-0.004
-0.01%
jan 1, 1989
51.754
-0.003
-0.01%
jan 1, 1990
51.75
-0.004
-0.01%
jan 1, 1991
51.746
-0.004
-0.01%
jan 1, 1992
51.745
-0.001
0.0%
jan 1, 1993
51.754
+0.009
0.02%
jan 1, 1994
51.764
+0.01
0.02%
jan 1, 1995
51.773
+0.009
0.02%
jan 1, 1996
51.783
+0.01
0.02%
jan 1, 1997
51.792
+0.009
0.02%
jan 1, 1998
51.8
+0.008
0.02%
jan 1, 1999
51.808
+0.008
0.02%
jan 1, 2000
51.815
+0.007
0.01%
jan 1, 2001
51.823
+0.008
0.02%
jan 1, 2002
51.833
+0.01
0.02%
jan 1, 2003
51.851
+0.018
0.03%
jan 1, 2004
51.869
+0.018
0.03%
jan 1, 2005
51.887
+0.018
0.03%
jan 1, 2006
51.905
+0.018
0.03%
jan 1, 2007
51.922
+0.017
0.03%
jan 1, 2008
51.94
+0.018
0.03%
jan 1, 2009
51.958
+0.018
0.03%
jan 1, 2010
51.976
+0.018
0.03%
jan 1, 2011
51.994
+0.018
0.03%
jan 1, 2012
52.012
+0.018
0.03%
jan 1, 2013
52.042
+0.03
0.06%
jan 1, 2014
52.084
+0.042
0.08%
jan 1, 2015
52.138
+0.054
0.1%
jan 1, 2016
52.203
+0.065
0.12%
Ranking of countries by current statistics by years


Comments: