29
/
en
AIzaSyAYiBZKx7MnpbEhh9jyipgxe19OcubqV5w
April 1, 2024
186052
Madagascar
MDG
true
2
1
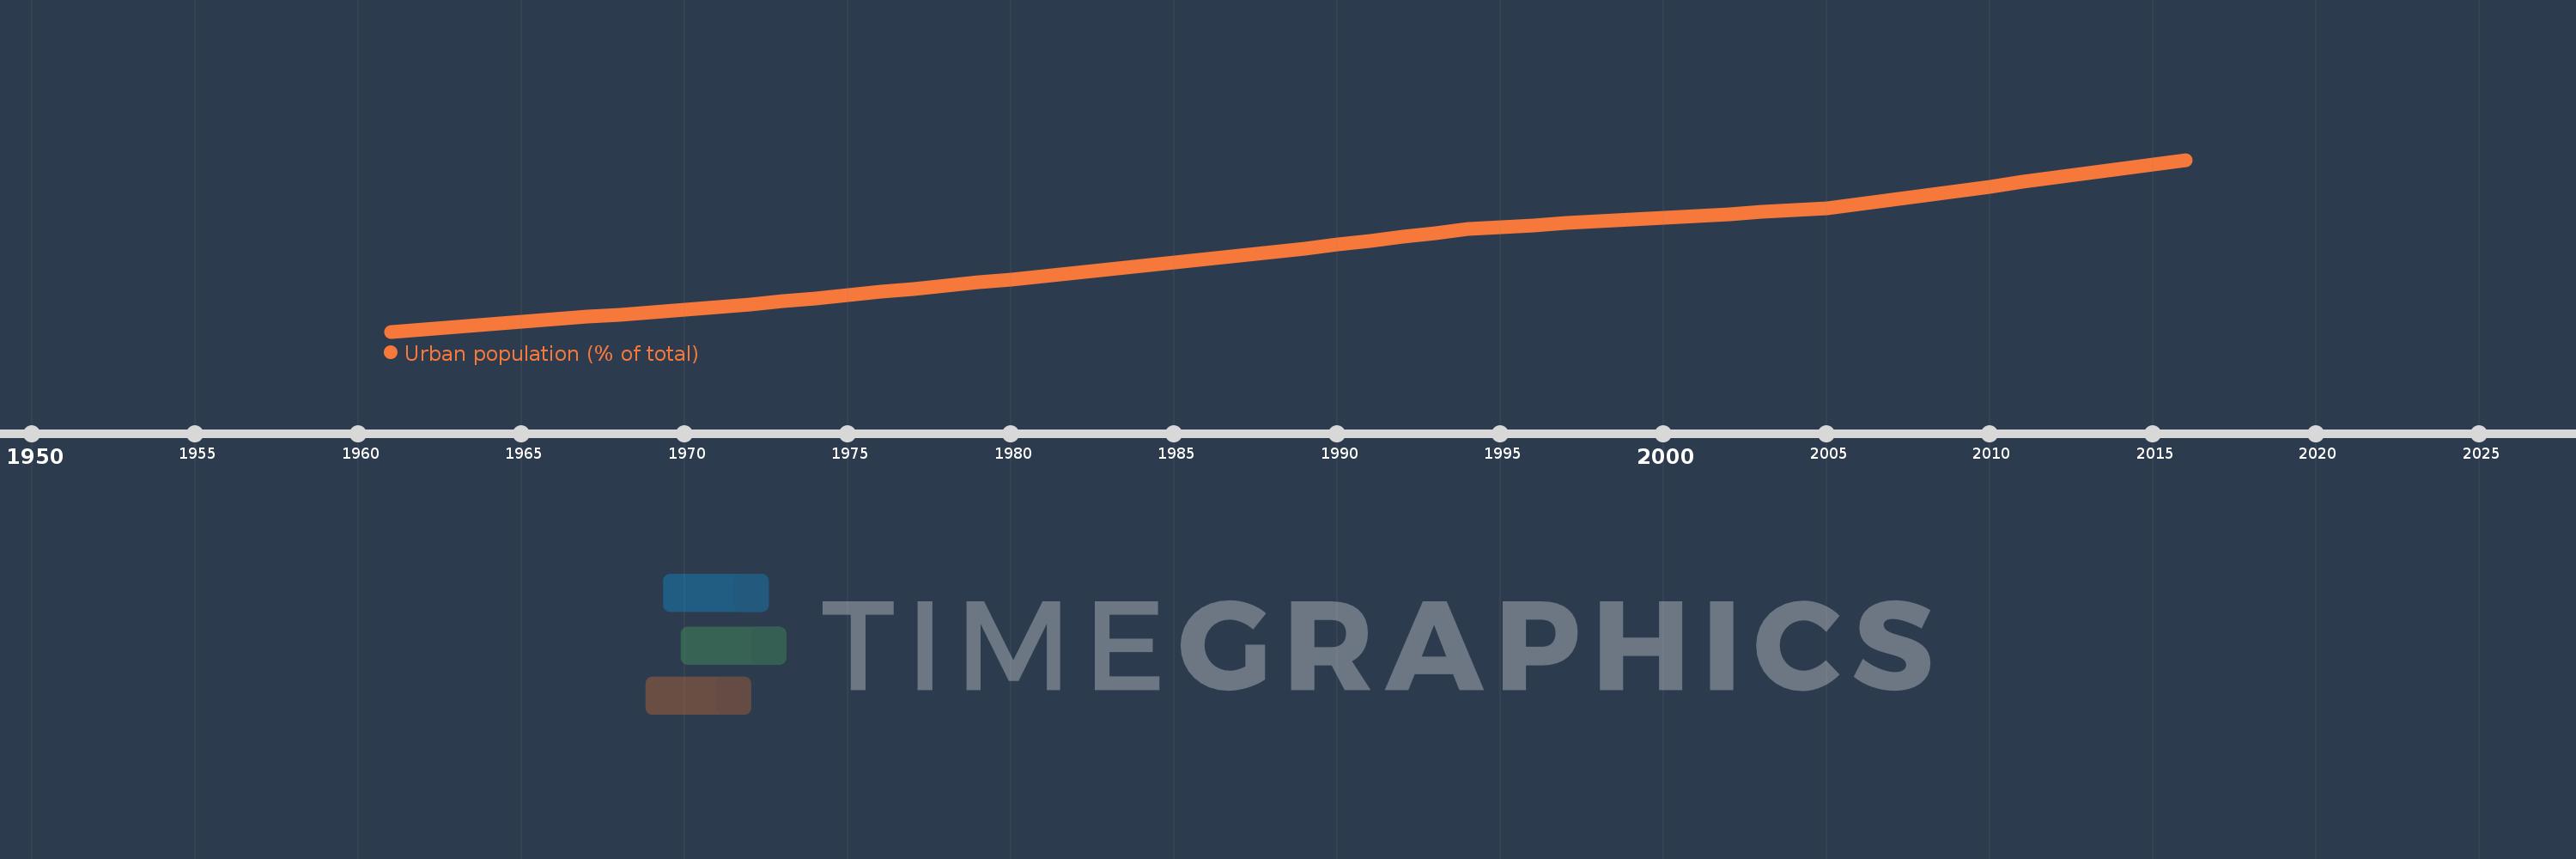
Urban population (% of total)
2016,2015,2014,2013,2012,2011,2010,2009,2008,2007,2006,2005,2004,2003,2002,2001,2000,1999,1998,1997,1996,1995,1994,1993,1992,1991,1990,1989,1988,1987,1986,1985,1984,1983,1982,1981,1980,1979,1978,1977,1976,1975,1974,1973,1972,1971,1970,1969,1968,1967,1966,1965,1964,1963,1962,1961
This statistics in other country:
AfghanistanAlbaniaAlgeriaAmerican SamoaAndorraAngolaAntigua and BarbudaArab WorldArgentinaArmeniaArubaAustraliaAustriaAzerbaijanBahamas, TheBahrainBangladeshBarbadosBelarusBelgiumBelizeBeninBermudaBhutanBoliviaBosnia and HerzegovinaBotswanaBrazilBritish Virgin IslandsBrunei DarussalamBulgariaBurkina FasoBurundiCabo VerdeCambodiaCameroonCanadaCaribbean small statesCayman IslandsCentral African RepublicCentral Europe and the BalticsChadChannel IslandsChileChinaColombiaComorosCongo, Dem. Rep.Congo, Rep.Costa RicaCote d'IvoireCroatiaCubaCuracaoCyprusCzech RepublicDenmarkDjiboutiDominicaDominican RepublicEarly-demographic dividendEast Asia & PacificEast Asia & Pacific (excluding high income)East Asia & Pacific (IDA & IBRD countries)EcuadorEgypt, Arab Rep.El SalvadorEquatorial GuineaEritreaEstoniaEthiopiaEuro areaEurope & Central AsiaEurope & Central Asia (excluding high income)Europe & Central Asia (IDA & IBRD countries)European UnionFaroe IslandsFijiFinlandFragile and conflict affected situationsFranceFrench PolynesiaGabonGambia, TheGeorgiaGermanyGhanaGibraltarGreeceGreenlandGrenadaGuamGuatemalaGuineaGuinea-BissauGuyanaHaitiHeavily indebted poor countries (HIPC)High incomeHondurasHong Kong SAR, ChinaHungaryIBRD onlyIcelandIDA & IBRD totalIDA blendIDA onlyIDA totalIndiaIndonesiaIran, Islamic Rep.IraqIrelandIsle of ManIsraelItalyJamaicaJapanJordanKazakhstanKenyaKiribatiKorea, Dem. People’s Rep.Korea, Rep.KuwaitKyrgyz RepublicLao PDRLate-demographic dividendLatin America & Caribbean Latin America & Caribbean (excluding high income)Latin America & the Caribbean (IDA & IBRD countries)LatviaLeast developed countries: UN classificationLebanonLesothoLiberiaLibyaLiechtensteinLithuaniaLow & middle incomeLow incomeLower middle incomeLuxembourgMacao SAR, ChinaMacedonia, FYRMadagascarMalawiMalaysiaMaldivesMaliMaltaMarshall IslandsMauritaniaMauritiusMexicoMicronesia, Fed. Sts.Middle East & North AfricaMiddle East & North Africa (excluding high income)Middle East & North Africa (IDA & IBRD countries)Middle incomeMoldovaMonacoMongoliaMontenegroMoroccoMozambiqueMyanmarNamibiaNauruNepalNetherlandsNew CaledoniaNew ZealandNicaraguaNigerNigeriaNorth AmericaNorthern Mariana IslandsNorwayOECD membersOmanOther small statesPacific island small statesPakistanPalauPanamaPapua New GuineaParaguayPeruPhilippinesPolandPortugalPost-demographic dividendPre-demographic dividendPuerto RicoQatarRomaniaRussian FederationRwandaSamoaSan MarinoSao Tome and PrincipeSaudi ArabiaSenegalSerbiaSeychellesSierra LeoneSingaporeSint Maarten (Dutch part)Slovak RepublicSloveniaSmall statesSolomon IslandsSomaliaSouth AfricaSouth AsiaSouth Asia (IDA & IBRD)South SudanSpainSri LankaSt. Kitts and NevisSt. LuciaSt. Vincent and the GrenadinesSub-Saharan Africa Sub-Saharan Africa (excluding high income)Sub-Saharan Africa (IDA & IBRD countries)SudanSurinameSwazilandSwedenSwitzerlandSyrian Arab RepublicTajikistanTanzaniaThailandTimor-LesteTogoTongaTrinidad and TobagoTunisiaTurkeyTurkmenistanTurks and Caicos IslandsTuvaluUgandaUkraineUnited Arab EmiratesUnited KingdomUnited StatesUpper middle incomeUruguayUzbekistanVanuatuVenezuela, RBVietnamVirgin Islands (U.S.)West Bank and GazaWorldYemen, Rep.ZambiaZimbabwe Timeline:
This timeline shows a graph from 1961 to 2016 of Madagascar. No data until 1960. Number of actual observations by date: 56.
Source name:
World Development Indicators
Source organization:
United Nations, World Urbanization Prospects.
Categories, topics:
Climate Change, Urban Development
Last updated:
apr 23, 2017
Indicators value changes by year
Minimum:
10.642
jan 1, 1961
Maximum:
35.105
jan 1, 2016
At the date of observation
Value
Absolute change
Change from previous value
jan 1, 1961
10.642
+10.642
0.0%
jan 1, 1962
10.971
+0.329
3.09%
jan 1, 1963
11.309
+0.338
3.08%
jan 1, 1964
11.657
+0.348
3.08%
jan 1, 1965
12.014
+0.357
3.06%
jan 1, 1966
12.379
+0.365
3.04%
jan 1, 1967
12.747
+0.368
2.97%
jan 1, 1968
13.074
+0.327
2.57%
jan 1, 1969
13.41
+0.336
2.57%
jan 1, 1970
13.751
+0.341
2.54%
jan 1, 1971
14.1
+0.349
2.54%
jan 1, 1972
14.526
+0.426
3.02%
jan 1, 1973
14.964
+0.438
3.02%
jan 1, 1974
15.411
+0.447
2.99%
jan 1, 1975
15.869
+0.458
2.97%
jan 1, 1976
16.334
+0.465
2.93%
jan 1, 1977
16.755
+0.421
2.58%
jan 1, 1978
17.184
+0.429
2.56%
jan 1, 1979
17.622
+0.438
2.55%
jan 1, 1980
18.068
+0.446
2.53%
jan 1, 1981
18.524
+0.456
2.52%
jan 1, 1982
18.988
+0.464
2.5%
jan 1, 1983
19.461
+0.473
2.49%
jan 1, 1984
19.943
+0.482
2.48%
jan 1, 1985
20.434
+0.491
2.46%
jan 1, 1986
20.933
+0.499
2.44%
jan 1, 1987
21.442
+0.509
2.43%
jan 1, 1988
21.959
+0.517
2.41%
jan 1, 1989
22.487
+0.528
2.4%
jan 1, 1990
23.021
+0.534
2.37%
jan 1, 1991
23.566
+0.545
2.37%
jan 1, 1992
24.119
+0.553
2.35%
jan 1, 1993
24.681
+0.562
2.33%
jan 1, 1994
25.251
+0.57
2.31%
jan 1, 1995
25.536
+0.285
1.13%
jan 1, 1996
25.796
+0.26
1.02%
jan 1, 1997
26.058
+0.262
1.02%
jan 1, 1998
26.321
+0.263
1.01%
jan 1, 1999
26.586
+0.265
1.01%
jan 1, 2000
26.853
+0.267
1.0%
jan 1, 2001
27.121
+0.268
1.0%
jan 1, 2002
27.391
+0.27
1.0%
jan 1, 2003
27.663
+0.272
0.99%
jan 1, 2004
27.936
+0.273
0.99%
jan 1, 2005
28.211
+0.275
0.98%
jan 1, 2006
28.814
+0.603
2.14%
jan 1, 2007
29.425
+0.611
2.12%
jan 1, 2008
30.043
+0.618
2.1%
jan 1, 2009
30.67
+0.627
2.09%
jan 1, 2010
31.298
+0.628
2.05%
jan 1, 2011
31.929
+0.631
2.02%
jan 1, 2012
32.562
+0.633
1.98%
jan 1, 2013
33.196
+0.634
1.95%
jan 1, 2014
33.832
+0.636
1.92%
jan 1, 2015
34.468
+0.636
1.88%
jan 1, 2016
35.105
+0.637
1.85%
Ranking of countries by current statistics by years


Comments: