29
/
en
AIzaSyAYiBZKx7MnpbEhh9jyipgxe19OcubqV5w
April 1, 2024
104477
Channel Islands
CHI
true
2
1
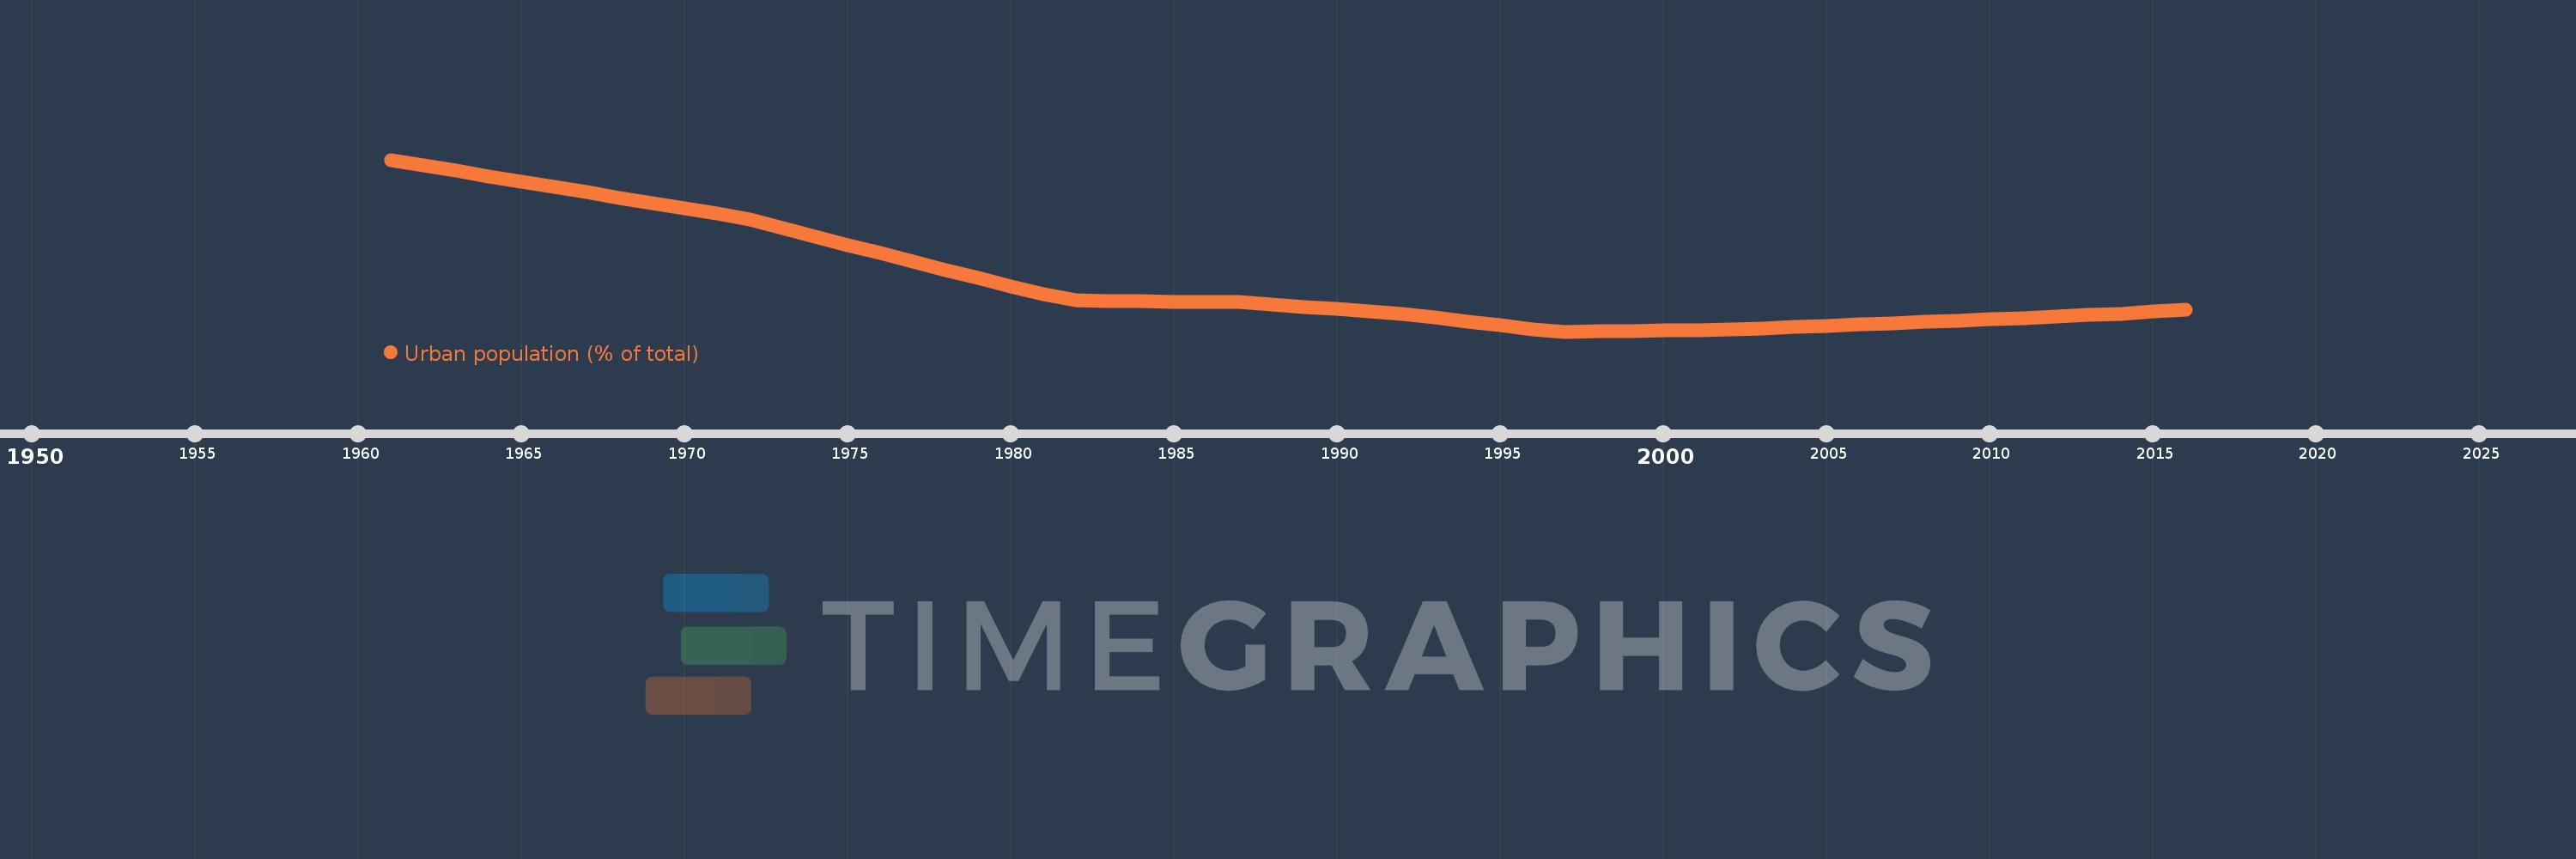
Urban population (% of total)
2016,2015,2014,2013,2012,2011,2010,2009,2008,2007,2006,2005,2004,2003,2002,2001,2000,1999,1998,1997,1996,1995,1994,1993,1992,1991,1990,1989,1988,1987,1986,1985,1984,1983,1982,1981,1980,1979,1978,1977,1976,1975,1974,1973,1972,1971,1970,1969,1968,1967,1966,1965,1964,1963,1962,1961
This statistics in other country:
AfghanistanAlbaniaAlgeriaAmerican SamoaAndorraAngolaAntigua and BarbudaArab WorldArgentinaArmeniaArubaAustraliaAustriaAzerbaijanBahamas, TheBahrainBangladeshBarbadosBelarusBelgiumBelizeBeninBermudaBhutanBoliviaBosnia and HerzegovinaBotswanaBrazilBritish Virgin IslandsBrunei DarussalamBulgariaBurkina FasoBurundiCabo VerdeCambodiaCameroonCanadaCaribbean small statesCayman IslandsCentral African RepublicCentral Europe and the BalticsChadChannel IslandsChileChinaColombiaComorosCongo, Dem. Rep.Congo, Rep.Costa RicaCote d'IvoireCroatiaCubaCuracaoCyprusCzech RepublicDenmarkDjiboutiDominicaDominican RepublicEarly-demographic dividendEast Asia & PacificEast Asia & Pacific (excluding high income)East Asia & Pacific (IDA & IBRD countries)EcuadorEgypt, Arab Rep.El SalvadorEquatorial GuineaEritreaEstoniaEthiopiaEuro areaEurope & Central AsiaEurope & Central Asia (excluding high income)Europe & Central Asia (IDA & IBRD countries)European UnionFaroe IslandsFijiFinlandFragile and conflict affected situationsFranceFrench PolynesiaGabonGambia, TheGeorgiaGermanyGhanaGibraltarGreeceGreenlandGrenadaGuamGuatemalaGuineaGuinea-BissauGuyanaHaitiHeavily indebted poor countries (HIPC)High incomeHondurasHong Kong SAR, ChinaHungaryIBRD onlyIcelandIDA & IBRD totalIDA blendIDA onlyIDA totalIndiaIndonesiaIran, Islamic Rep.IraqIrelandIsle of ManIsraelItalyJamaicaJapanJordanKazakhstanKenyaKiribatiKorea, Dem. People’s Rep.Korea, Rep.KuwaitKyrgyz RepublicLao PDRLate-demographic dividendLatin America & Caribbean Latin America & Caribbean (excluding high income)Latin America & the Caribbean (IDA & IBRD countries)LatviaLeast developed countries: UN classificationLebanonLesothoLiberiaLibyaLiechtensteinLithuaniaLow & middle incomeLow incomeLower middle incomeLuxembourgMacao SAR, ChinaMacedonia, FYRMadagascarMalawiMalaysiaMaldivesMaliMaltaMarshall IslandsMauritaniaMauritiusMexicoMicronesia, Fed. Sts.Middle East & North AfricaMiddle East & North Africa (excluding high income)Middle East & North Africa (IDA & IBRD countries)Middle incomeMoldovaMonacoMongoliaMontenegroMoroccoMozambiqueMyanmarNamibiaNauruNepalNetherlandsNew CaledoniaNew ZealandNicaraguaNigerNigeriaNorth AmericaNorthern Mariana IslandsNorwayOECD membersOmanOther small statesPacific island small statesPakistanPalauPanamaPapua New GuineaParaguayPeruPhilippinesPolandPortugalPost-demographic dividendPre-demographic dividendPuerto RicoQatarRomaniaRussian FederationRwandaSamoaSan MarinoSao Tome and PrincipeSaudi ArabiaSenegalSerbiaSeychellesSierra LeoneSingaporeSint Maarten (Dutch part)Slovak RepublicSloveniaSmall statesSolomon IslandsSomaliaSouth AfricaSouth AsiaSouth Asia (IDA & IBRD)South SudanSpainSri LankaSt. Kitts and NevisSt. LuciaSt. Vincent and the GrenadinesSub-Saharan Africa Sub-Saharan Africa (excluding high income)Sub-Saharan Africa (IDA & IBRD countries)SudanSurinameSwazilandSwedenSwitzerlandSyrian Arab RepublicTajikistanTanzaniaThailandTimor-LesteTogoTongaTrinidad and TobagoTunisiaTurkeyTurkmenistanTurks and Caicos IslandsTuvaluUgandaUkraineUnited Arab EmiratesUnited KingdomUnited StatesUpper middle incomeUruguayUzbekistanVanuatuVenezuela, RBVietnamVirgin Islands (U.S.)West Bank and GazaWorldYemen, Rep.ZambiaZimbabwe Timeline:
This timeline shows a graph from 1961 to 2016 of Channel Islands. No data until 1960. Number of actual observations by date: 56.
Source name:
World Development Indicators
Source organization:
United Nations, World Urbanization Prospects.
Categories, topics:
Climate Change, Urban Development
Last updated:
apr 23, 2017
Indicators value changes by year
At the date of observation
Value
Absolute change
Change from previous value
jan 1, 1961
38.7
+38.7
0.0%
jan 1, 1962
38.436
-0.264
-0.68%
jan 1, 1963
38.172
-0.264
-0.69%
jan 1, 1964
37.909
-0.263
-0.69%
jan 1, 1965
37.646
-0.263
-0.69%
jan 1, 1966
37.385
-0.261
-0.69%
jan 1, 1967
37.124
-0.261
-0.7%
jan 1, 1968
36.864
-0.26
-0.7%
jan 1, 1969
36.604
-0.26
-0.71%
jan 1, 1970
36.346
-0.258
-0.7%
jan 1, 1971
36.088
-0.258
-0.71%
jan 1, 1972
35.803
-0.285
-0.79%
jan 1, 1973
35.394
-0.409
-1.14%
jan 1, 1974
34.989
-0.405
-1.14%
jan 1, 1975
34.585
-0.404
-1.15%
jan 1, 1976
34.183
-0.402
-1.16%
jan 1, 1977
33.783
-0.4
-1.17%
jan 1, 1978
33.387
-0.396
-1.17%
jan 1, 1979
32.992
-0.395
-1.18%
jan 1, 1980
32.599
-0.393
-1.19%
jan 1, 1981
32.209
-0.39
-1.2%
jan 1, 1982
31.909
-0.3
-0.93%
jan 1, 1983
31.89
-0.019
-0.06%
jan 1, 1984
31.871
-0.019
-0.06%
jan 1, 1985
31.851
-0.02
-0.06%
jan 1, 1986
31.832
-0.019
-0.06%
jan 1, 1987
31.813
-0.019
-0.06%
jan 1, 1988
31.707
-0.106
-0.33%
jan 1, 1989
31.602
-0.105
-0.33%
jan 1, 1990
31.497
-0.105
-0.33%
jan 1, 1991
31.392
-0.105
-0.33%
jan 1, 1992
31.262
-0.13
-0.41%
jan 1, 1993
31.076
-0.186
-0.59%
jan 1, 1994
30.891
-0.185
-0.6%
jan 1, 1995
30.706
-0.185
-0.6%
jan 1, 1996
30.522
-0.184
-0.6%
jan 1, 1997
30.4
-0.122
-0.4%
jan 1, 1998
30.416
+0.016
0.05%
jan 1, 1999
30.432
+0.016
0.05%
jan 1, 2000
30.449
+0.017
0.06%
jan 1, 2001
30.465
+0.016
0.05%
jan 1, 2002
30.495
+0.03
0.1%
jan 1, 2003
30.557
+0.062
0.2%
jan 1, 2004
30.619
+0.062
0.2%
jan 1, 2005
30.681
+0.062
0.2%
jan 1, 2006
30.743
+0.062
0.2%
jan 1, 2007
30.805
+0.062
0.2%
jan 1, 2008
30.867
+0.062
0.2%
jan 1, 2009
30.929
+0.062
0.2%
jan 1, 2010
30.992
+0.063
0.2%
jan 1, 2011
31.054
+0.062
0.2%
jan 1, 2012
31.116
+0.062
0.2%
jan 1, 2013
31.189
+0.073
0.23%
jan 1, 2014
31.271
+0.082
0.26%
jan 1, 2015
31.363
+0.092
0.29%
jan 1, 2016
31.465
+0.102
0.33%
Ranking of countries by current statistics by years


Comments: