29
/
en
AIzaSyAYiBZKx7MnpbEhh9jyipgxe19OcubqV5w
April 1, 2024
92293
British Virgin Islands
VGB
true
2
1
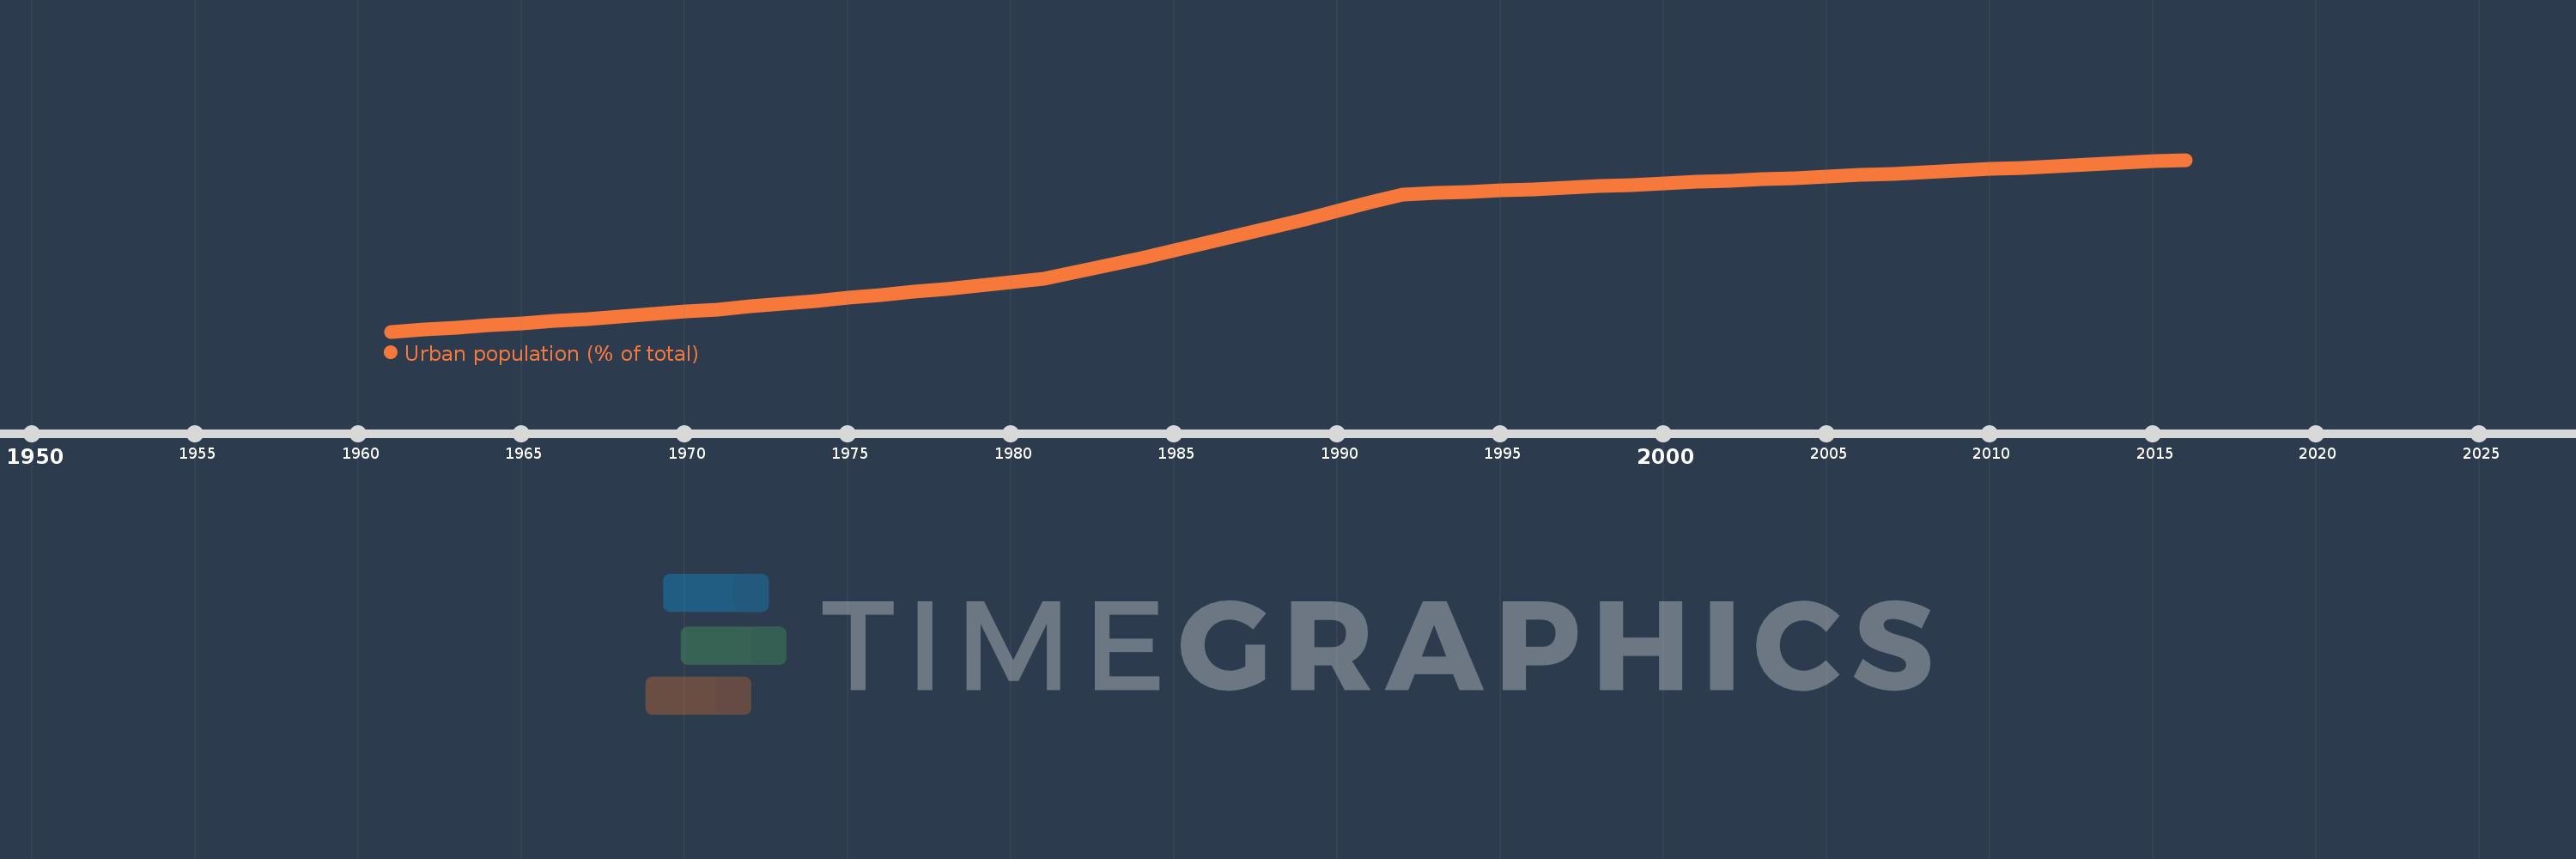
Urban population (% of total)
2016,2015,2014,2013,2012,2011,2010,2009,2008,2007,2006,2005,2004,2003,2002,2001,2000,1999,1998,1997,1996,1995,1994,1993,1992,1991,1990,1989,1988,1987,1986,1985,1984,1983,1982,1981,1980,1979,1978,1977,1976,1975,1974,1973,1972,1971,1970,1969,1968,1967,1966,1965,1964,1963,1962,1961
This statistics in other country:
AfghanistanAlbaniaAlgeriaAmerican SamoaAndorraAngolaAntigua and BarbudaArab WorldArgentinaArmeniaArubaAustraliaAustriaAzerbaijanBahamas, TheBahrainBangladeshBarbadosBelarusBelgiumBelizeBeninBermudaBhutanBoliviaBosnia and HerzegovinaBotswanaBrazilBritish Virgin IslandsBrunei DarussalamBulgariaBurkina FasoBurundiCabo VerdeCambodiaCameroonCanadaCaribbean small statesCayman IslandsCentral African RepublicCentral Europe and the BalticsChadChannel IslandsChileChinaColombiaComorosCongo, Dem. Rep.Congo, Rep.Costa RicaCote d'IvoireCroatiaCubaCuracaoCyprusCzech RepublicDenmarkDjiboutiDominicaDominican RepublicEarly-demographic dividendEast Asia & PacificEast Asia & Pacific (excluding high income)East Asia & Pacific (IDA & IBRD countries)EcuadorEgypt, Arab Rep.El SalvadorEquatorial GuineaEritreaEstoniaEthiopiaEuro areaEurope & Central AsiaEurope & Central Asia (excluding high income)Europe & Central Asia (IDA & IBRD countries)European UnionFaroe IslandsFijiFinlandFragile and conflict affected situationsFranceFrench PolynesiaGabonGambia, TheGeorgiaGermanyGhanaGibraltarGreeceGreenlandGrenadaGuamGuatemalaGuineaGuinea-BissauGuyanaHaitiHeavily indebted poor countries (HIPC)High incomeHondurasHong Kong SAR, ChinaHungaryIBRD onlyIcelandIDA & IBRD totalIDA blendIDA onlyIDA totalIndiaIndonesiaIran, Islamic Rep.IraqIrelandIsle of ManIsraelItalyJamaicaJapanJordanKazakhstanKenyaKiribatiKorea, Dem. People’s Rep.Korea, Rep.KuwaitKyrgyz RepublicLao PDRLate-demographic dividendLatin America & Caribbean Latin America & Caribbean (excluding high income)Latin America & the Caribbean (IDA & IBRD countries)LatviaLeast developed countries: UN classificationLebanonLesothoLiberiaLibyaLiechtensteinLithuaniaLow & middle incomeLow incomeLower middle incomeLuxembourgMacao SAR, ChinaMacedonia, FYRMadagascarMalawiMalaysiaMaldivesMaliMaltaMarshall IslandsMauritaniaMauritiusMexicoMicronesia, Fed. Sts.Middle East & North AfricaMiddle East & North Africa (excluding high income)Middle East & North Africa (IDA & IBRD countries)Middle incomeMoldovaMonacoMongoliaMontenegroMoroccoMozambiqueMyanmarNamibiaNauruNepalNetherlandsNew CaledoniaNew ZealandNicaraguaNigerNigeriaNorth AmericaNorthern Mariana IslandsNorwayOECD membersOmanOther small statesPacific island small statesPakistanPalauPanamaPapua New GuineaParaguayPeruPhilippinesPolandPortugalPost-demographic dividendPre-demographic dividendPuerto RicoQatarRomaniaRussian FederationRwandaSamoaSan MarinoSao Tome and PrincipeSaudi ArabiaSenegalSerbiaSeychellesSierra LeoneSingaporeSint Maarten (Dutch part)Slovak RepublicSloveniaSmall statesSolomon IslandsSomaliaSouth AfricaSouth AsiaSouth Asia (IDA & IBRD)South SudanSpainSri LankaSt. Kitts and NevisSt. LuciaSt. Vincent and the GrenadinesSub-Saharan Africa Sub-Saharan Africa (excluding high income)Sub-Saharan Africa (IDA & IBRD countries)SudanSurinameSwazilandSwedenSwitzerlandSyrian Arab RepublicTajikistanTanzaniaThailandTimor-LesteTogoTongaTrinidad and TobagoTunisiaTurkeyTurkmenistanTurks and Caicos IslandsTuvaluUgandaUkraineUnited Arab EmiratesUnited KingdomUnited StatesUpper middle incomeUruguayUzbekistanVanuatuVenezuela, RBVietnamVirgin Islands (U.S.)West Bank and GazaWorldYemen, Rep.ZambiaZimbabwe Timeline:
This timeline shows a graph from 1961 to 2016 of British Virgin Islands. No data until 1960. Number of actual observations by date: 56.
Source name:
World Development Indicators
Source organization:
United Nations, World Urbanization Prospects.
Categories, topics:
Climate Change, Urban Development
Last updated:
apr 23, 2017
Indicators value changes by year
Minimum:
12.228
jan 1, 1961
Maximum:
46.186
jan 1, 2016
At the date of observation
Value
Absolute change
Change from previous value
jan 1, 1961
12.228
+12.228
0.0%
jan 1, 1962
12.618
+0.39
3.19%
jan 1, 1963
13.019
+0.401
3.18%
jan 1, 1964
13.43
+0.411
3.16%
jan 1, 1965
13.854
+0.424
3.16%
jan 1, 1966
14.287
+0.433
3.13%
jan 1, 1967
14.732
+0.445
3.11%
jan 1, 1968
15.188
+0.456
3.1%
jan 1, 1969
15.657
+0.469
3.09%
jan 1, 1970
16.135
+0.478
3.05%
jan 1, 1971
16.635
+0.5
3.1%
jan 1, 1972
17.174
+0.539
3.24%
jan 1, 1973
17.728
+0.554
3.23%
jan 1, 1974
18.294
+0.566
3.19%
jan 1, 1975
18.875
+0.581
3.18%
jan 1, 1976
19.47
+0.595
3.15%
jan 1, 1977
20.081
+0.611
3.14%
jan 1, 1978
20.703
+0.622
3.1%
jan 1, 1979
21.34
+0.637
3.08%
jan 1, 1980
21.992
+0.652
3.06%
jan 1, 1981
22.741
+0.749
3.41%
jan 1, 1982
24.039
+1.298
5.71%
jan 1, 1983
25.389
+1.35
5.62%
jan 1, 1984
26.788
+1.399
5.51%
jan 1, 1985
28.237
+1.449
5.41%
jan 1, 1986
29.728
+1.491
5.28%
jan 1, 1987
31.266
+1.538
5.17%
jan 1, 1988
32.846
+1.58
5.05%
jan 1, 1989
34.468
+1.622
4.94%
jan 1, 1990
36.123
+1.655
4.8%
jan 1, 1991
37.814
+1.691
4.68%
jan 1, 1992
39.334
+1.52
4.02%
jan 1, 1993
39.603
+0.269
0.68%
jan 1, 1994
39.872
+0.269
0.68%
jan 1, 1995
40.142
+0.27
0.68%
jan 1, 1996
40.413
+0.271
0.68%
jan 1, 1997
40.684
+0.271
0.67%
jan 1, 1998
40.955
+0.271
0.67%
jan 1, 1999
41.228
+0.273
0.67%
jan 1, 2000
41.5
+0.272
0.66%
jan 1, 2001
41.774
+0.274
0.66%
jan 1, 2002
42.048
+0.274
0.66%
jan 1, 2003
42.324
+0.276
0.66%
jan 1, 2004
42.604
+0.28
0.66%
jan 1, 2005
42.887
+0.283
0.66%
jan 1, 2006
43.173
+0.286
0.67%
jan 1, 2007
43.462
+0.289
0.67%
jan 1, 2008
43.753
+0.291
0.67%
jan 1, 2009
44.048
+0.295
0.67%
jan 1, 2010
44.345
+0.297
0.67%
jan 1, 2011
44.645
+0.3
0.68%
jan 1, 2012
44.948
+0.303
0.68%
jan 1, 2013
45.253
+0.305
0.68%
jan 1, 2014
45.562
+0.309
0.68%
jan 1, 2015
45.872
+0.31
0.68%
jan 1, 2016
46.186
+0.314
0.68%
Ranking of countries by current statistics by years


Comments: