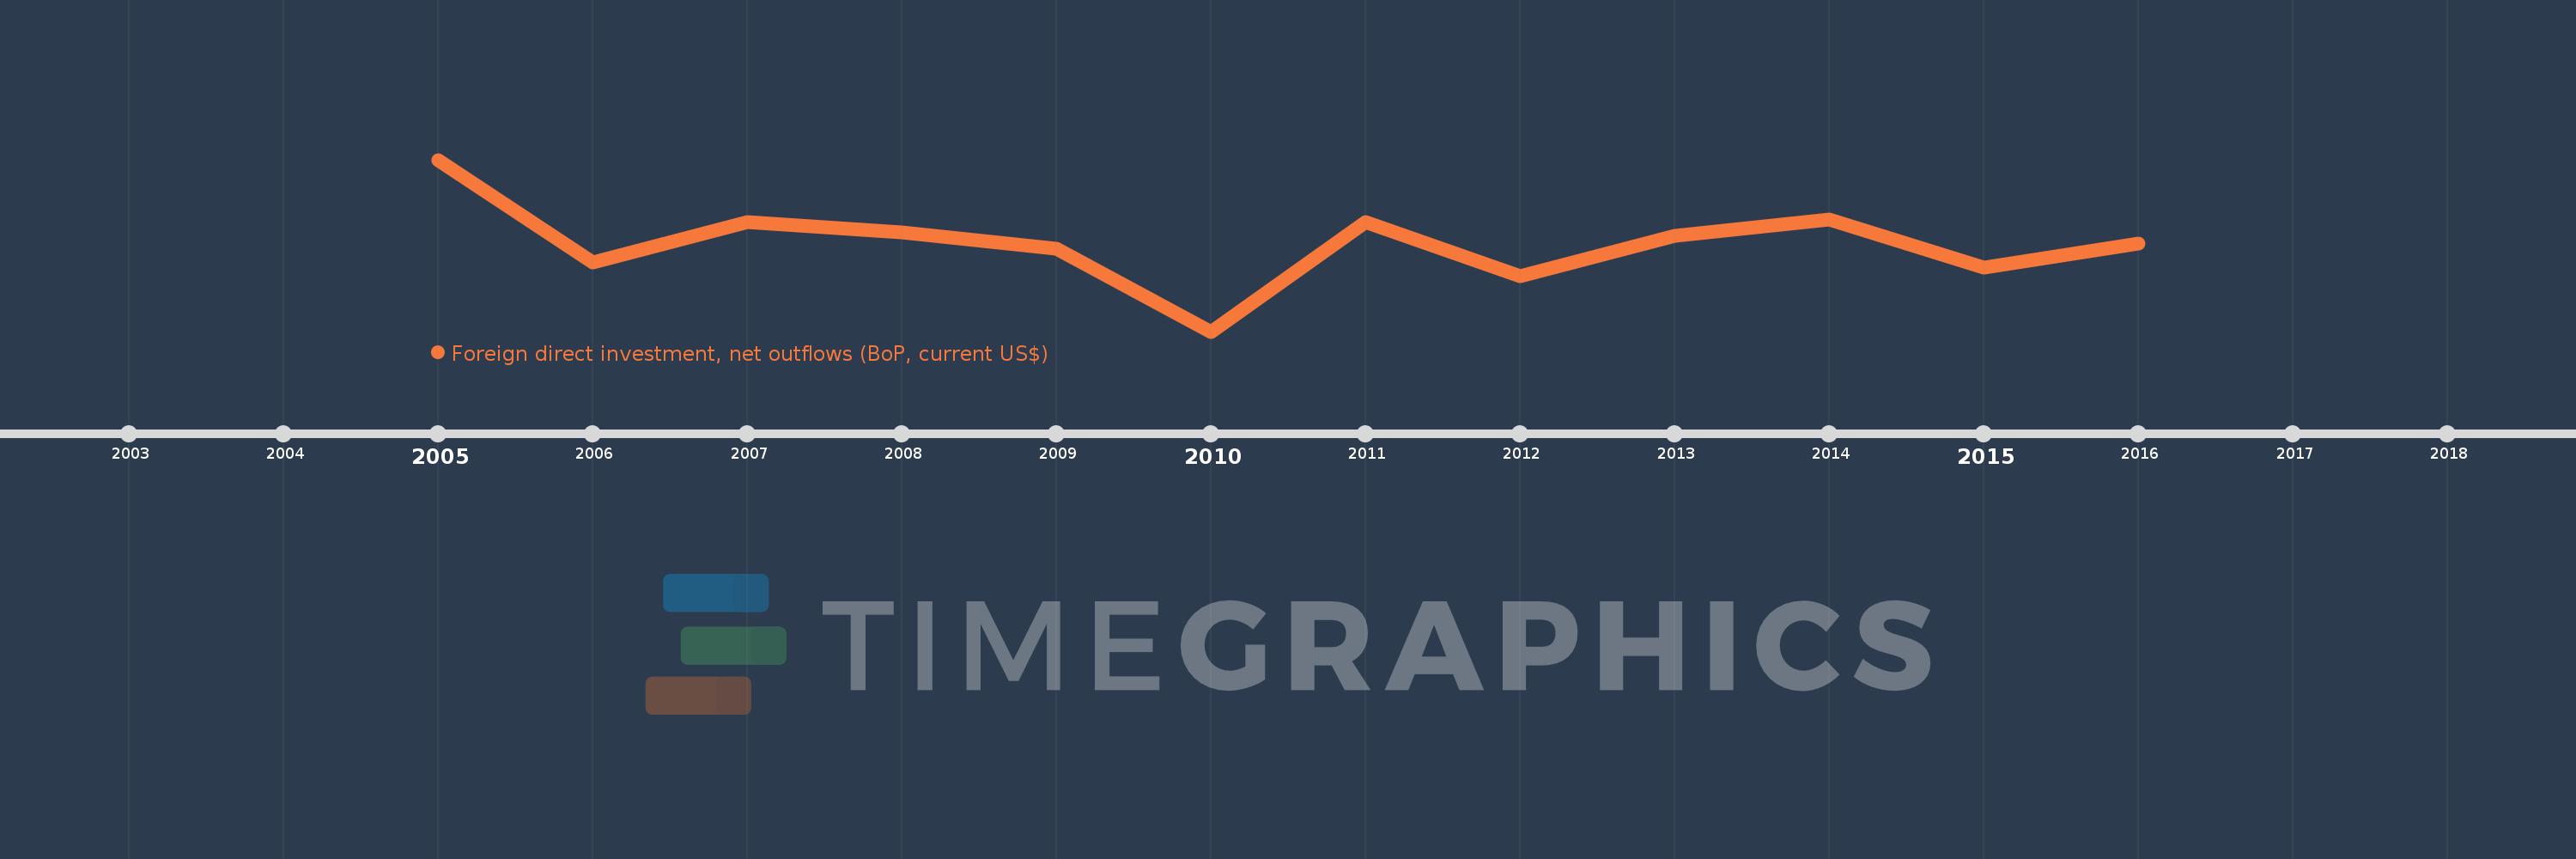
This timeline shows a graph from 2005 to 2016 of Bosnia and Herzegovina. No data until 2004. Number of actual observations by date: 12.
Source name:
World Development Indicators
Source organization:
International Monetary Fund, Balance of Payments database, supplemented by data from the United Nations Conference on Trade and Development and official national sources.
Categories, topics:
Economy & Growth, Financial Sector
Last updated:
apr 23, 2017
Indicators value changes by year
Meaning:
47.374 mln
Minimum:
-93.488 mln
jan 1, 2010
Maximum:
181.285 mln
jan 1, 2005
At the date of observation
Value
Absolute change
Change from the previous value
jan 1, 2005
181.285 mln
+181.285 mln
0.0%
jan 1, 2006
16.439 mln
-164.846 mln
-90.93%
jan 1, 2007
81.831 mln
+65.392 mln
397.79%
jan 1, 2008
64.599 mln
-17.232 mln
-21.06%
jan 1, 2009
39.448 mln
-25.151 mln
-38.93%
jan 1, 2010
-93.488 mln
-132.935 mln
-336.99%
jan 1, 2011
81.18 mln
+174.667 mln
-186.83%
jan 1, 2012
-4.826 mln
-86.005 mln
-105.94%
jan 1, 2013
59.601 mln
+64.426 mln
-1.34K%
jan 1, 2014
86.262 mln
+26.662 mln
44.73%
jan 1, 2015
8.339 mln
-77.923 mln
-90.33%
jan 1, 2016
47.82 mln
+39.481 mln
473.43%
Ranking of countries by current statistics by years