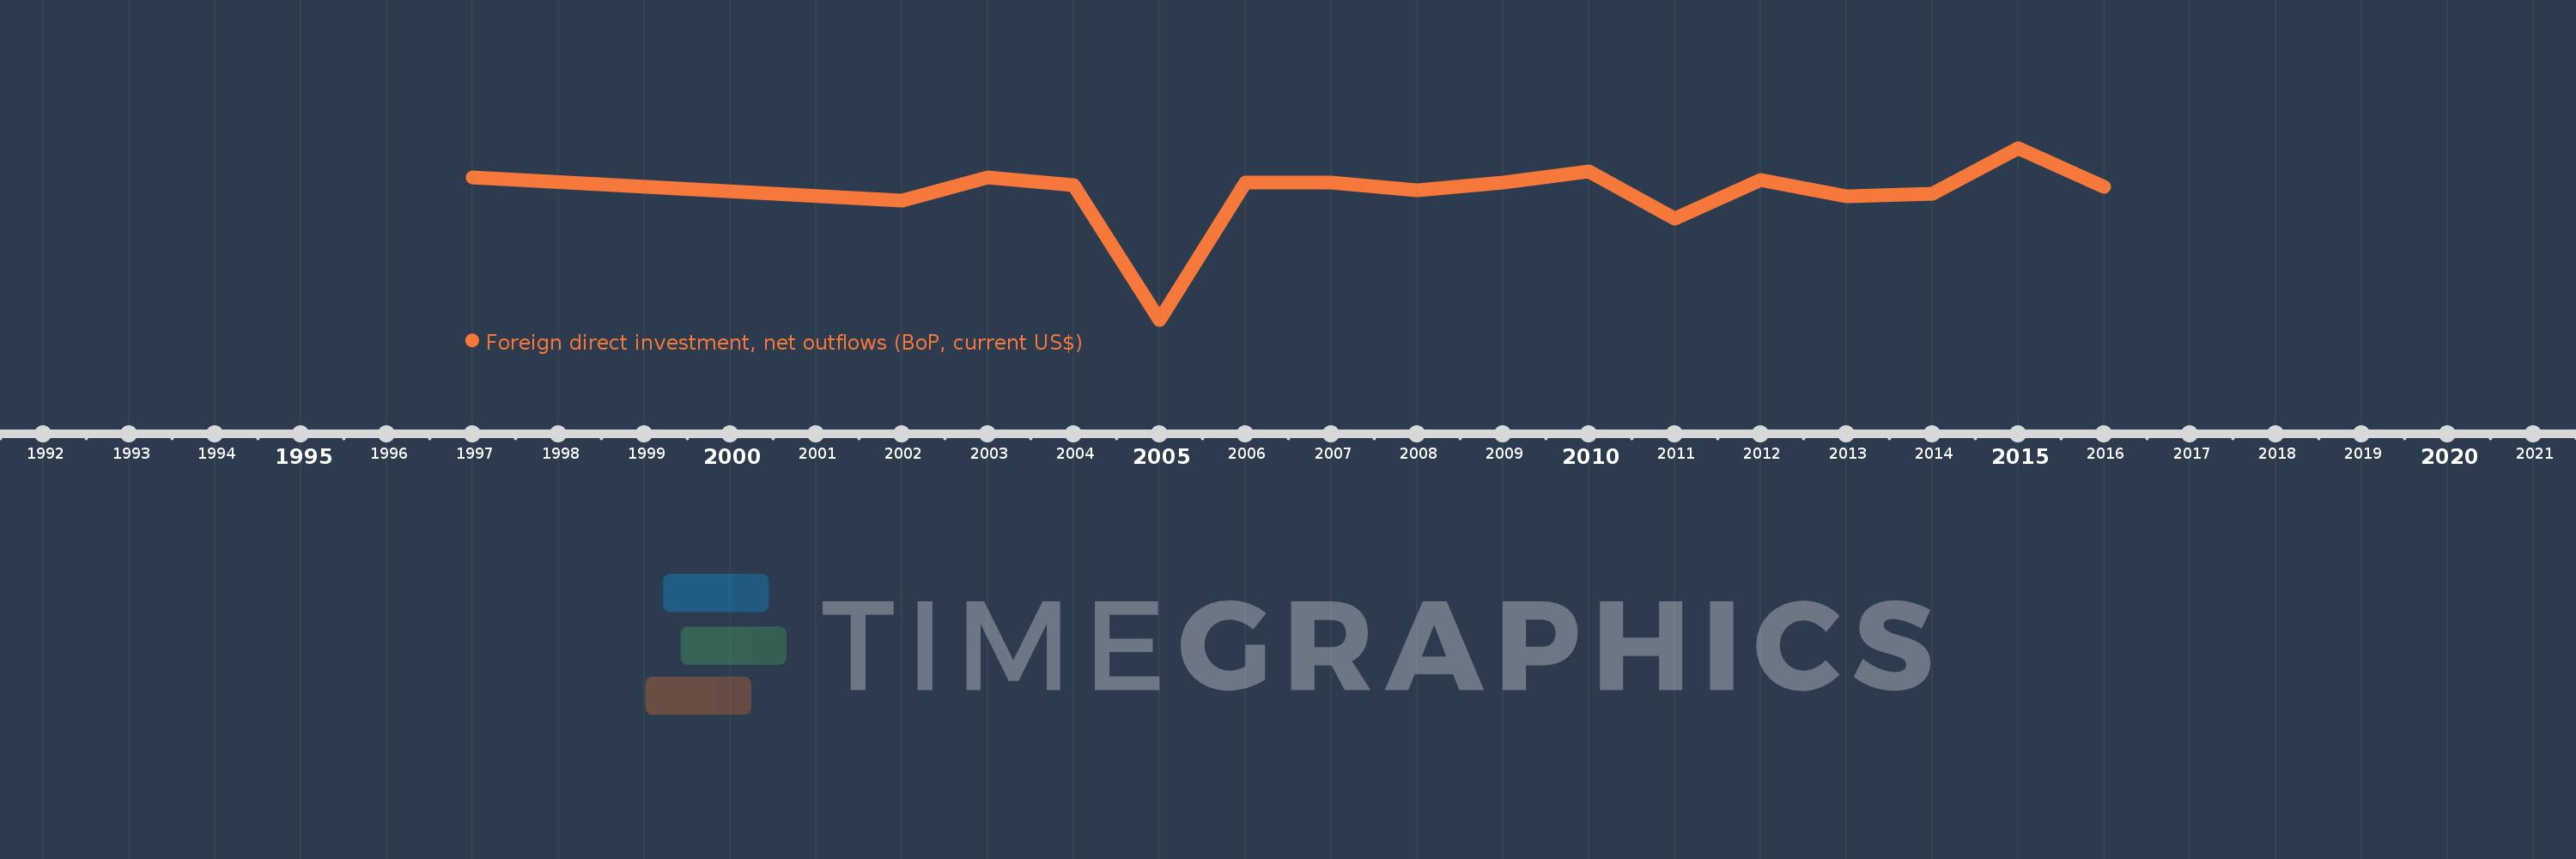
This timeline shows a graph from 1997 to 2016 of Guinea-Bissau. No data until 1996. Number of actual observations by date: 16.
Source name:
World Development Indicators
Source organization:
International Monetary Fund, Balance of Payments database, supplemented by data from the United Nations Conference on Trade and Development and official national sources.
Categories, topics:
Economy & Growth, Financial Sector
Last updated:
apr 23, 2017
Indicators value changes by year
Meaning:
37.176K
Minimum:
-7.502 mln
jan 1, 2005
Maximum:
2.747 mln
jan 1, 2015
At the date of observation
Value
Absolute change
Change from the previous value
jan 1, 1997
977.418K
+977.418K
0.0%
jan 1, 2002
-395.613K
-1.373 mln
-140.48%
jan 1, 2003
1.004 mln
+1.4 mln
-353.86%
jan 1, 2004
516.173K
-488.148K
-48.6%
jan 1, 2005
-7.502 mln
-8.018 mln
-1.55K%
jan 1, 2006
695.777K
+8.197 mln
-109.28%
jan 1, 2007
667.444K
-28.332K
-4.07%
jan 1, 2008
210.001K
-457.443K
-68.54%
jan 1, 2009
660.007K
+450.006K
214.29%
jan 1, 2010
1.35 mln
+689.993K
104.54%
jan 1, 2011
-1.47 mln
-2.82 mln
-208.89%
jan 1, 2012
858.294K
+2.328 mln
-158.39%
jan 1, 2013
-148.866K
-1.007 mln
-117.34%
jan 1, 2014
1.842K
+150.708K
-101.24%
jan 1, 2015
2.747 mln
+2.746 mln
149.05K%
jan 1, 2016
422.301K
-2.325 mln
-84.63%
Ranking of countries by current statistics by years