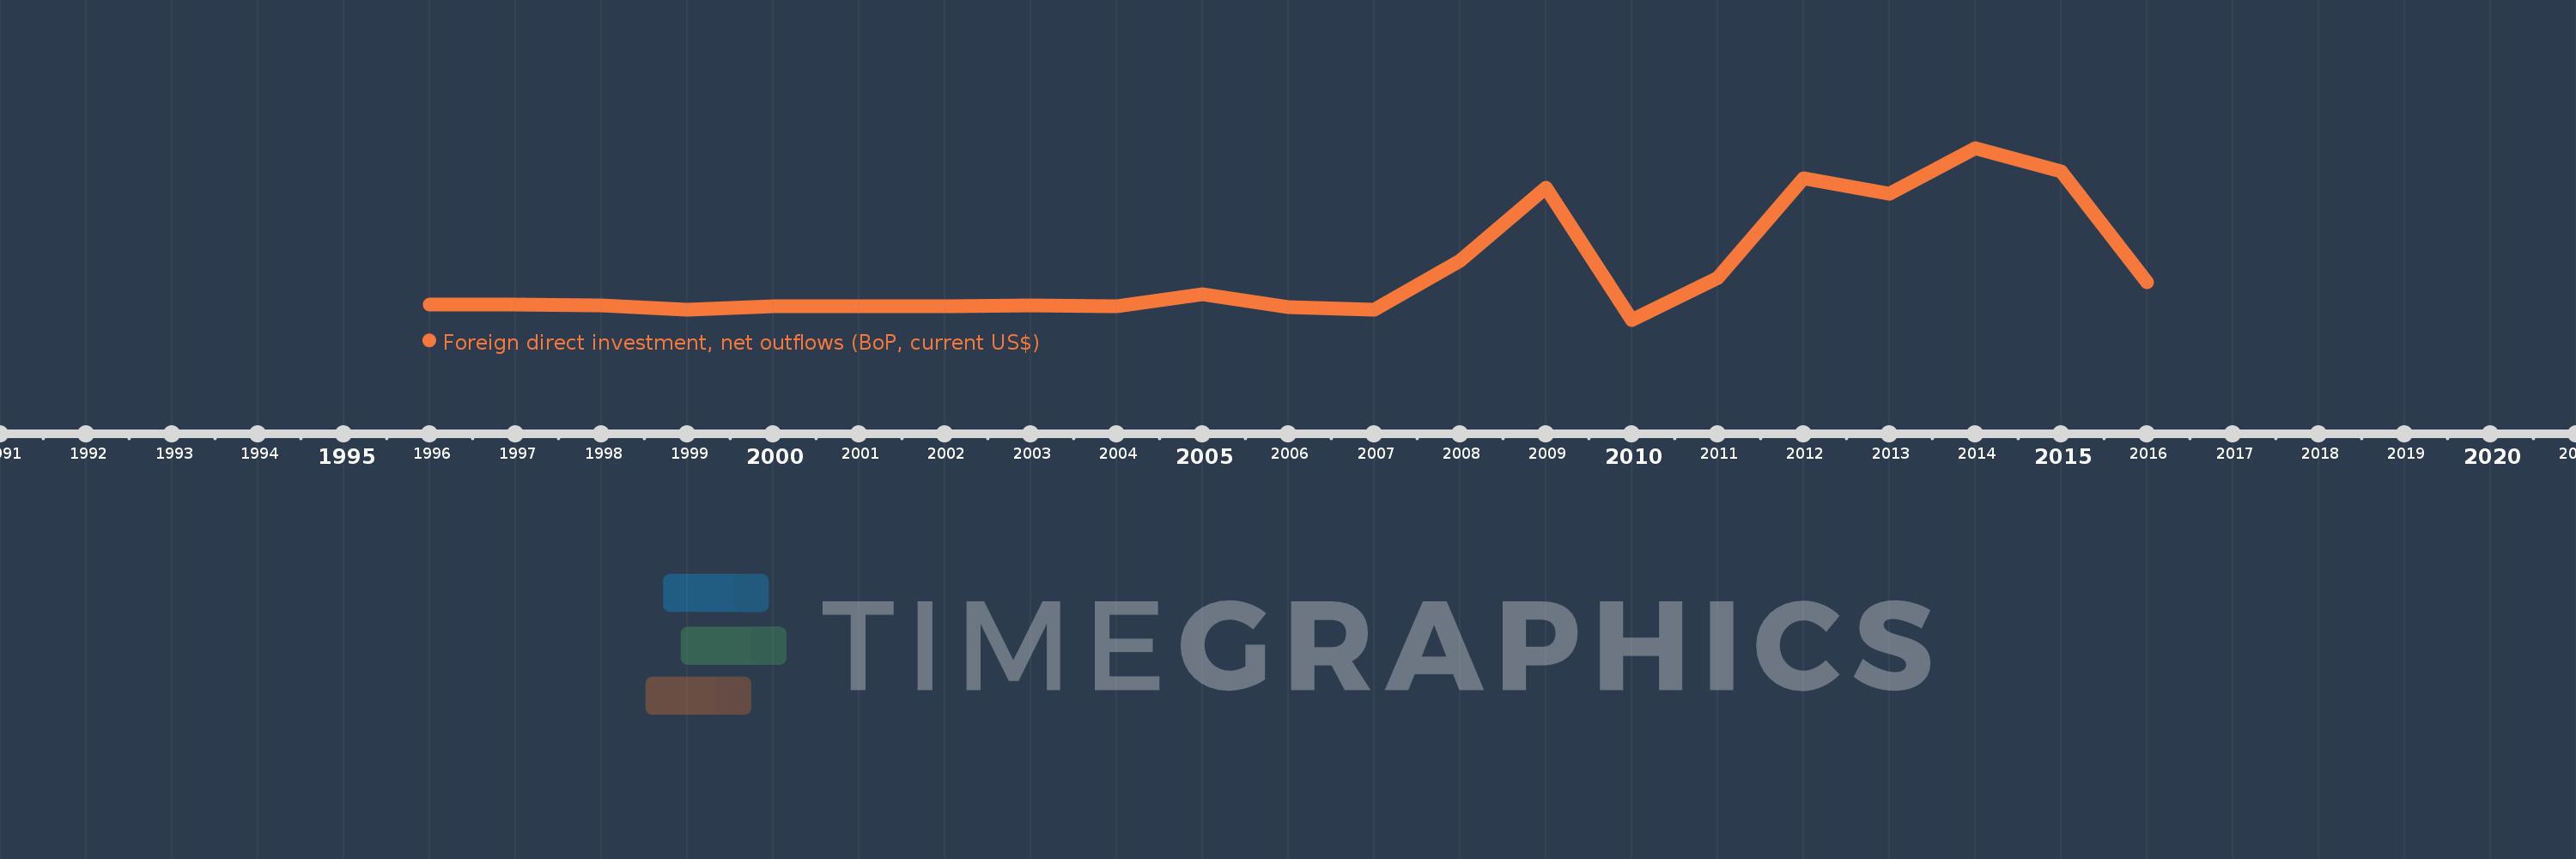
This timeline shows a graph from 1996 to 2016 of Moldova. No data until 1995. Number of actual observations by date: 21.
Source name:
World Development Indicators
Source organization:
International Monetary Fund, Balance of Payments database, supplemented by data from the United Nations Conference on Trade and Development and official national sources.
Categories, topics:
Economy & Growth, Financial Sector
Last updated:
apr 23, 2017
Indicators value changes by year
Meaning:
9.448 mln
Minimum:
-3.42 mln
jan 1, 2010
Maximum:
41.62 mln
jan 1, 2014
At the date of observation
Value
Absolute change
Change from the previous value
jan 1, 1996
520.0K
+520.0K
0.0%
jan 1, 1997
560.0K
+40.0K
7.69%
jan 1, 1998
450.0K
-110.0K
-19.64%
jan 1, 1999
-730.0K
-1.18 mln
-262.22%
jan 1, 2000
40.0K
+770.0K
-105.48%
jan 1, 2001
80.0K
+40.0K
100.0%
jan 1, 2002
120.0K
+40.0K
50.0%
jan 1, 2003
450.0K
+330.0K
275.0%
jan 1, 2004
110.0K
-340.0K
-75.56%
jan 1, 2005
3.22 mln
+3.11 mln
2.83K%
jan 1, 2006
-160.0K
-3.38 mln
-104.97%
jan 1, 2007
-720.0K
-560.0K
350.0%
jan 1, 2008
12.12 mln
+12.84 mln
-1.78K%
jan 1, 2009
31.23 mln
+19.11 mln
157.67%
jan 1, 2010
-3.42 mln
-34.65 mln
-110.95%
jan 1, 2011
7.6 mln
+11.02 mln
-322.22%
jan 1, 2012
33.78 mln
+26.18 mln
344.47%
jan 1, 2013
29.58 mln
-4.2 mln
-12.43%
jan 1, 2014
41.62 mln
+12.04 mln
40.7%
jan 1, 2015
35.49 mln
-6.13 mln
-14.73%
jan 1, 2016
6.47 mln
-29.02 mln
-81.77%
Ranking of countries by current statistics by years