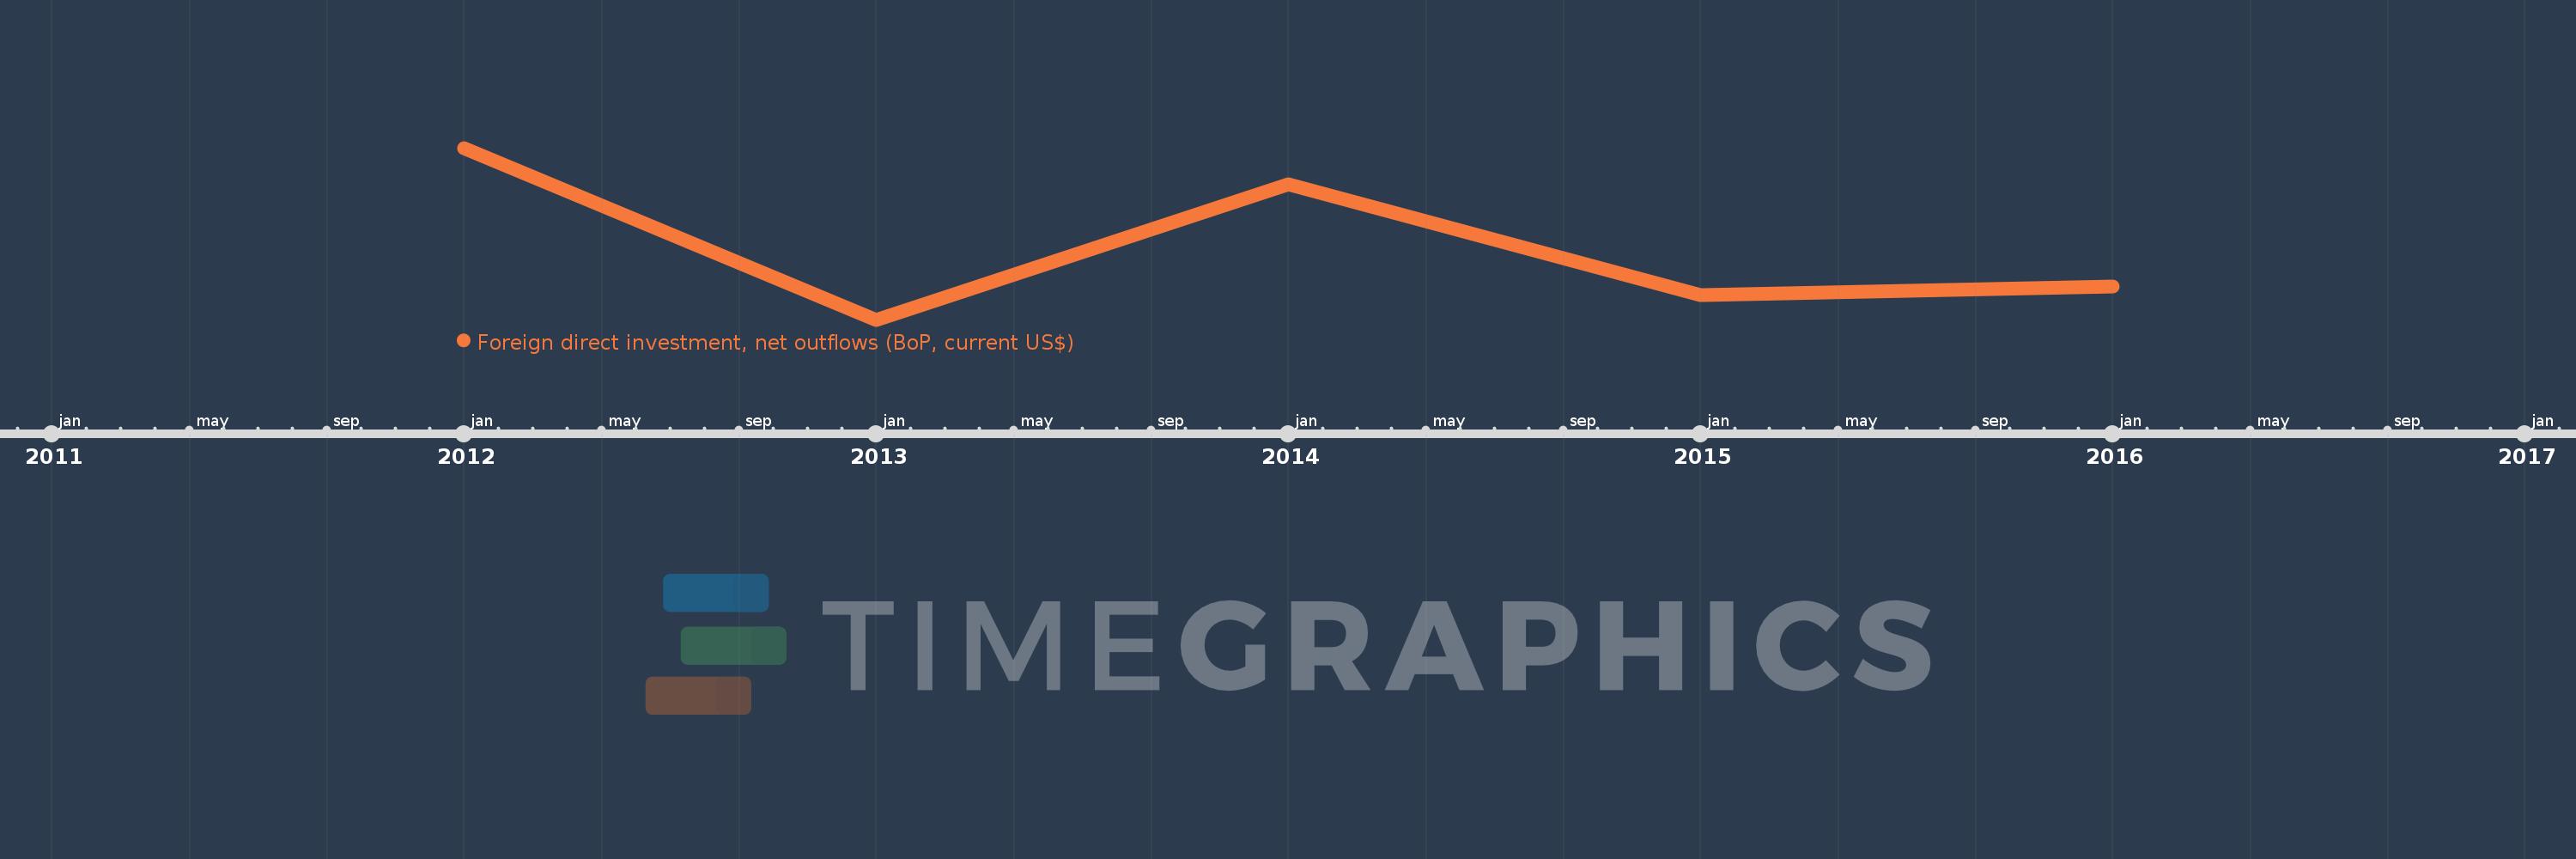
This timeline shows a graph from 2012 to 2016 of Gambia, The. No data until 2011. Number of actual observations by date: 5.
Source name:
World Development Indicators
Source organization:
International Monetary Fund, Balance of Payments database, supplemented by data from the United Nations Conference on Trade and Development and official national sources.
Categories, topics:
Economy & Growth, Financial Sector
Last updated:
apr 23, 2017
Indicators value changes by year
Meaning:
30.536 mln
Minimum:
9.973 mln
jan 1, 2013
Maximum:
58.317 mln
jan 1, 2012
At the date of observation
Value
Absolute change
Change from the previous value
jan 1, 2012
58.317 mln
+58.317 mln
0.0%
jan 1, 2013
9.973 mln
-48.344 mln
-82.9%
jan 1, 2014
48.166 mln
+38.193 mln
382.97%
jan 1, 2015
16.792 mln
-31.374 mln
-65.14%
jan 1, 2016
19.432 mln
+2.64 mln
15.72%
Ranking of countries by current statistics by years