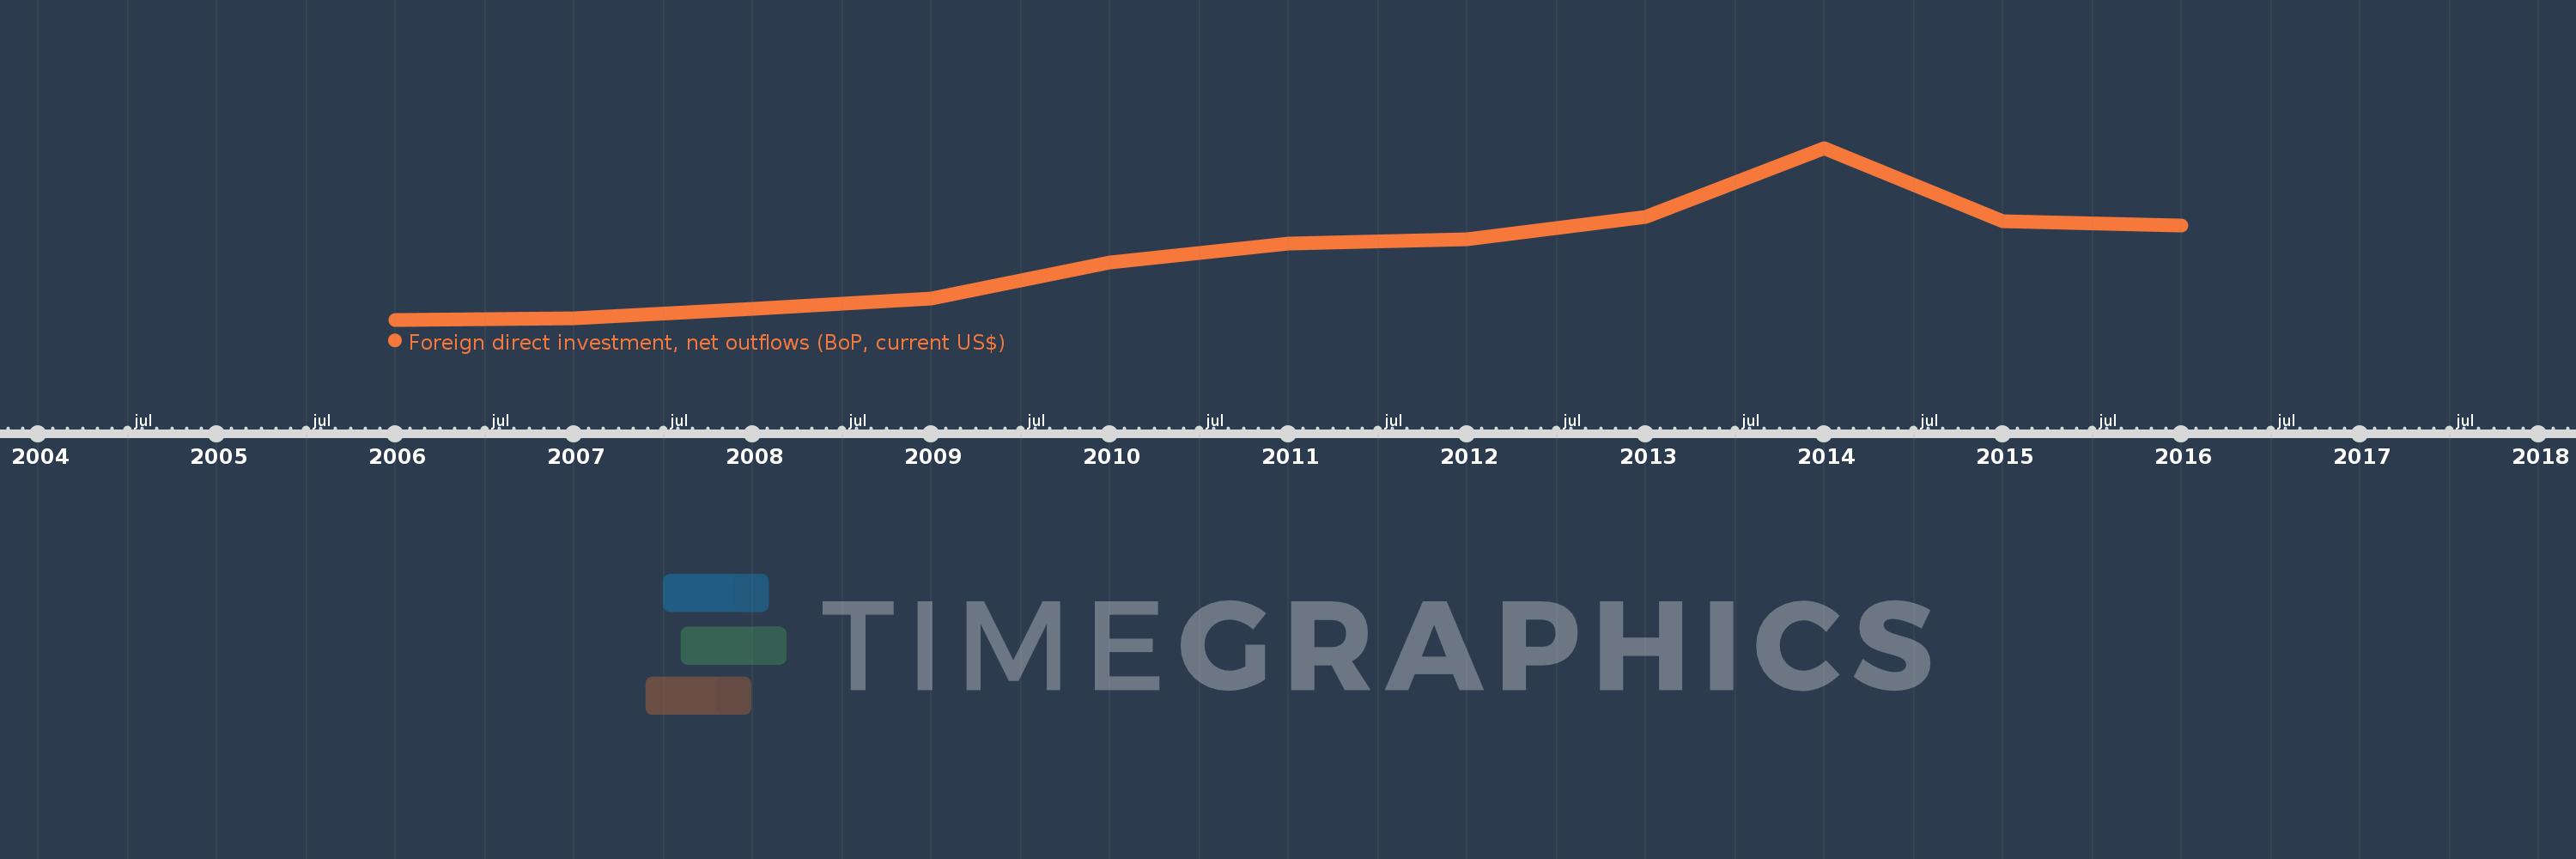
This timeline shows a graph from 2006 to 2016 of Vietnam. No data until 2005. Number of actual observations by date: 11.
Source name:
World Development Indicators
Source organization:
International Monetary Fund, Balance of Payments database, supplemented by data from the United Nations Conference on Trade and Development and official national sources.
Categories, topics:
Economy & Growth, Financial Sector
Last updated:
apr 23, 2017
Indicators value changes by year
Meaning:
780.909 mln
Minimum:
65.0 mln
jan 1, 2006
Maximum:
1.956 bln
jan 1, 2014
At the date of observation
Value
Absolute change
Change from the previous value
jan 1, 2006
65.0 mln
+65.0 mln
0.0%
jan 1, 2007
85.0 mln
+20.0 mln
30.77%
jan 1, 2008
184.0 mln
+99.0 mln
116.47%
jan 1, 2009
300.0 mln
+116.0 mln
63.04%
jan 1, 2010
700.0 mln
+400.0 mln
133.33%
jan 1, 2011
900.0 mln
+200.0 mln
28.57%
jan 1, 2012
950.0 mln
+50.0 mln
5.56%
jan 1, 2013
1.2 bln
+250.0 mln
26.32%
jan 1, 2014
1.956 bln
+756.0 mln
63.0%
jan 1, 2015
1.15 bln
-806.0 mln
-41.21%
jan 1, 2016
1.1 bln
-50.0 mln
-4.35%
Ranking of countries by current statistics by years