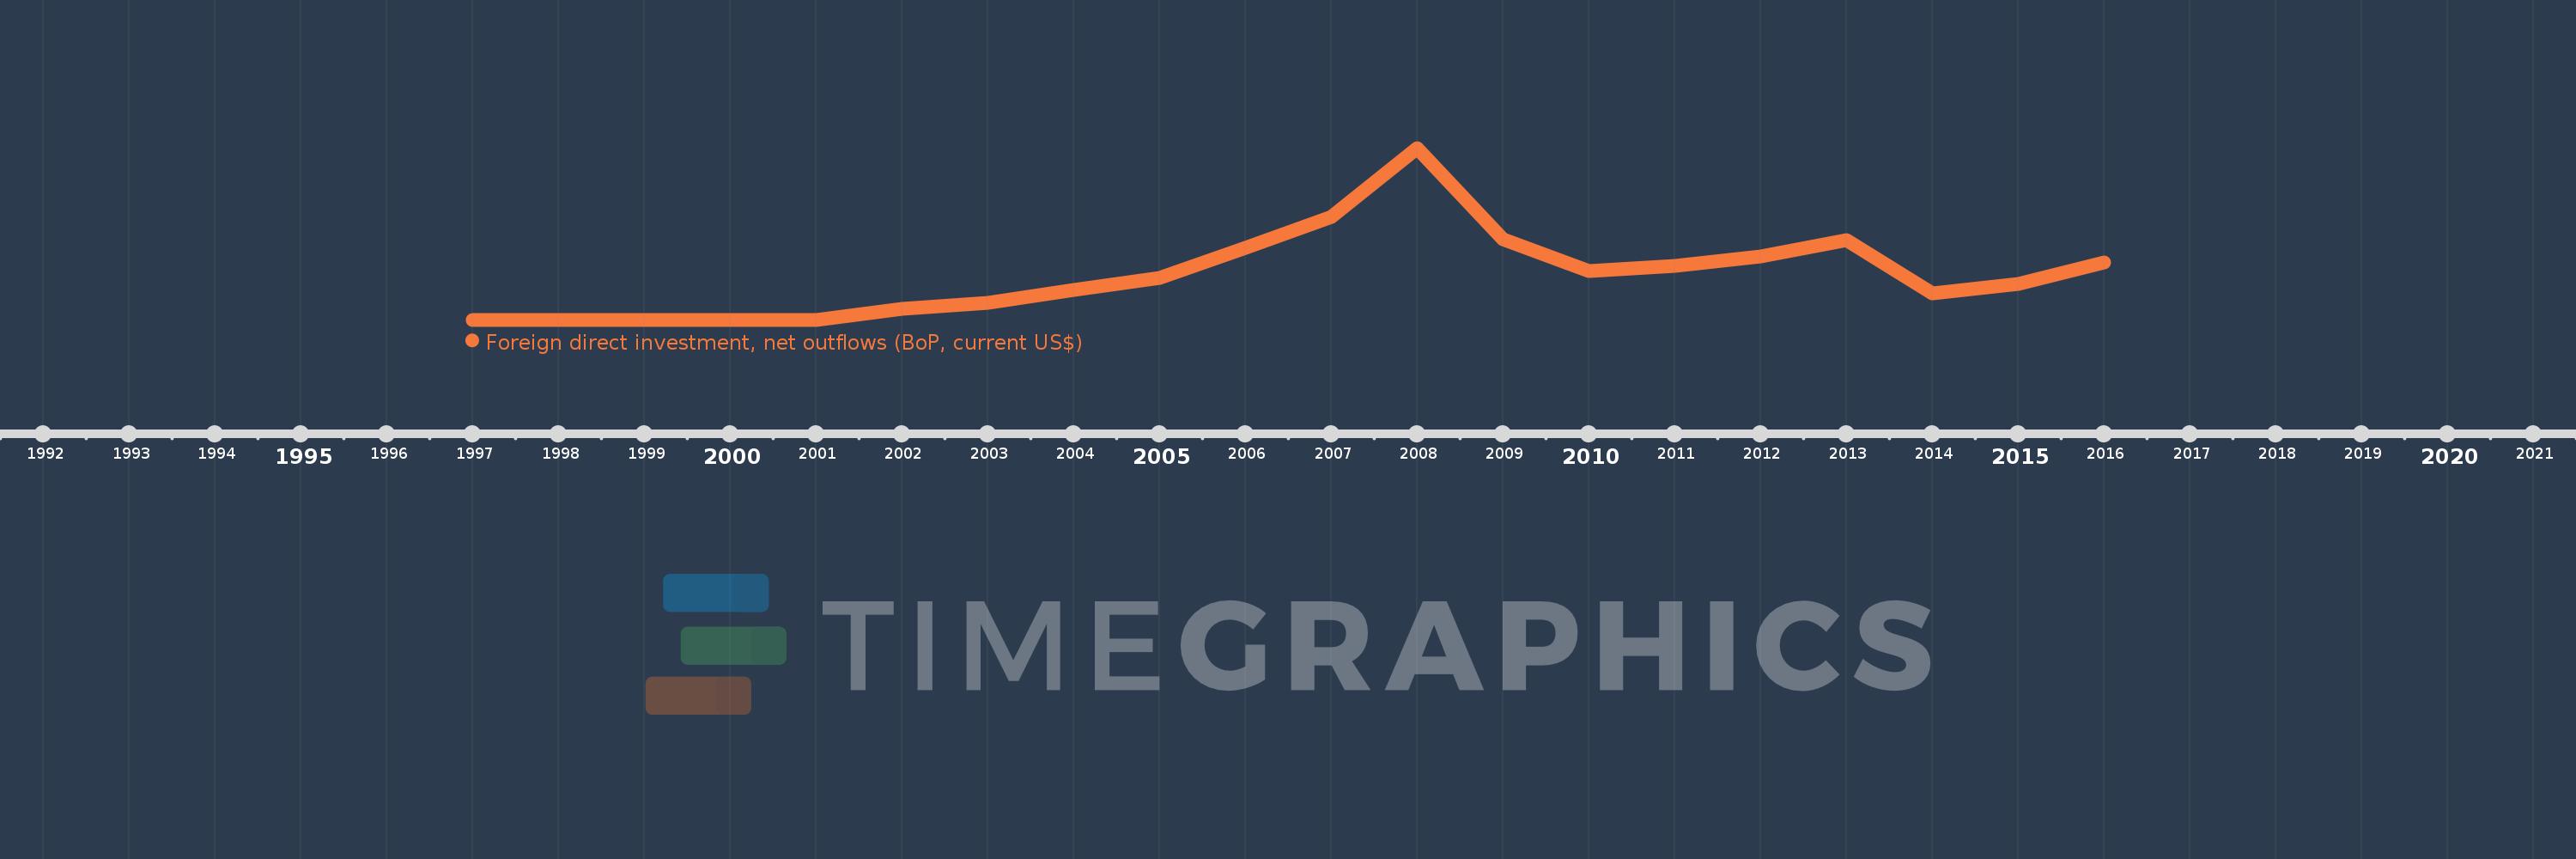
This timeline shows a graph from 1997 to 2016 of Azerbaijan. No data until 1996. Number of actual observations by date: 19.
Source name:
World Development Indicators
Source organization:
International Monetary Fund, Balance of Payments database, supplemented by data from the United Nations Conference on Trade and Development and official national sources.
Categories, topics:
Economy & Growth, Financial Sector
Last updated:
apr 23, 2017
Indicators value changes by year
Meaning:
2.632 bln
Minimum:
4.0K
jan 1, 1998
Maximum:
9.629 bln
jan 1, 2008
At the date of observation
Value
Absolute change
Change from the previous value
jan 1, 1997
3.899 mln
+3.899 mln
0.0%
jan 1, 1998
4.0K
-3.895 mln
-99.9%
jan 1, 1999
20.0K
+16.0K
400.0%
jan 1, 2001
760.0K
+740.0K
3.7K%
jan 1, 2002
593.066 mln
+592.306 mln
77.94K%
jan 1, 2003
957.756 mln
+364.69 mln
61.49%
jan 1, 2004
1.656 bln
+697.827 mln
72.86%
jan 1, 2005
2.368 bln
+712.241 mln
43.02%
jan 1, 2006
4.017 bln
+1.649 bln
69.66%
jan 1, 2007
5.775 bln
+1.758 bln
43.77%
jan 1, 2008
9.629 bln
+3.853 bln
66.72%
jan 1, 2009
4.528 bln
-5.101 bln
-52.98%
jan 1, 2010
2.753 bln
-1.775 bln
-39.2%
jan 1, 2011
3.022 bln
+268.993 mln
9.77%
jan 1, 2012
3.553 bln
+530.696 mln
17.56%
jan 1, 2013
4.481 bln
+928.305 mln
26.13%
jan 1, 2014
1.478 bln
-3.003 bln
-67.02%
jan 1, 2015
1.987 bln
+509.186 mln
34.45%
jan 1, 2016
3.209 bln
+1.222 bln
61.51%
Ranking of countries by current statistics by years