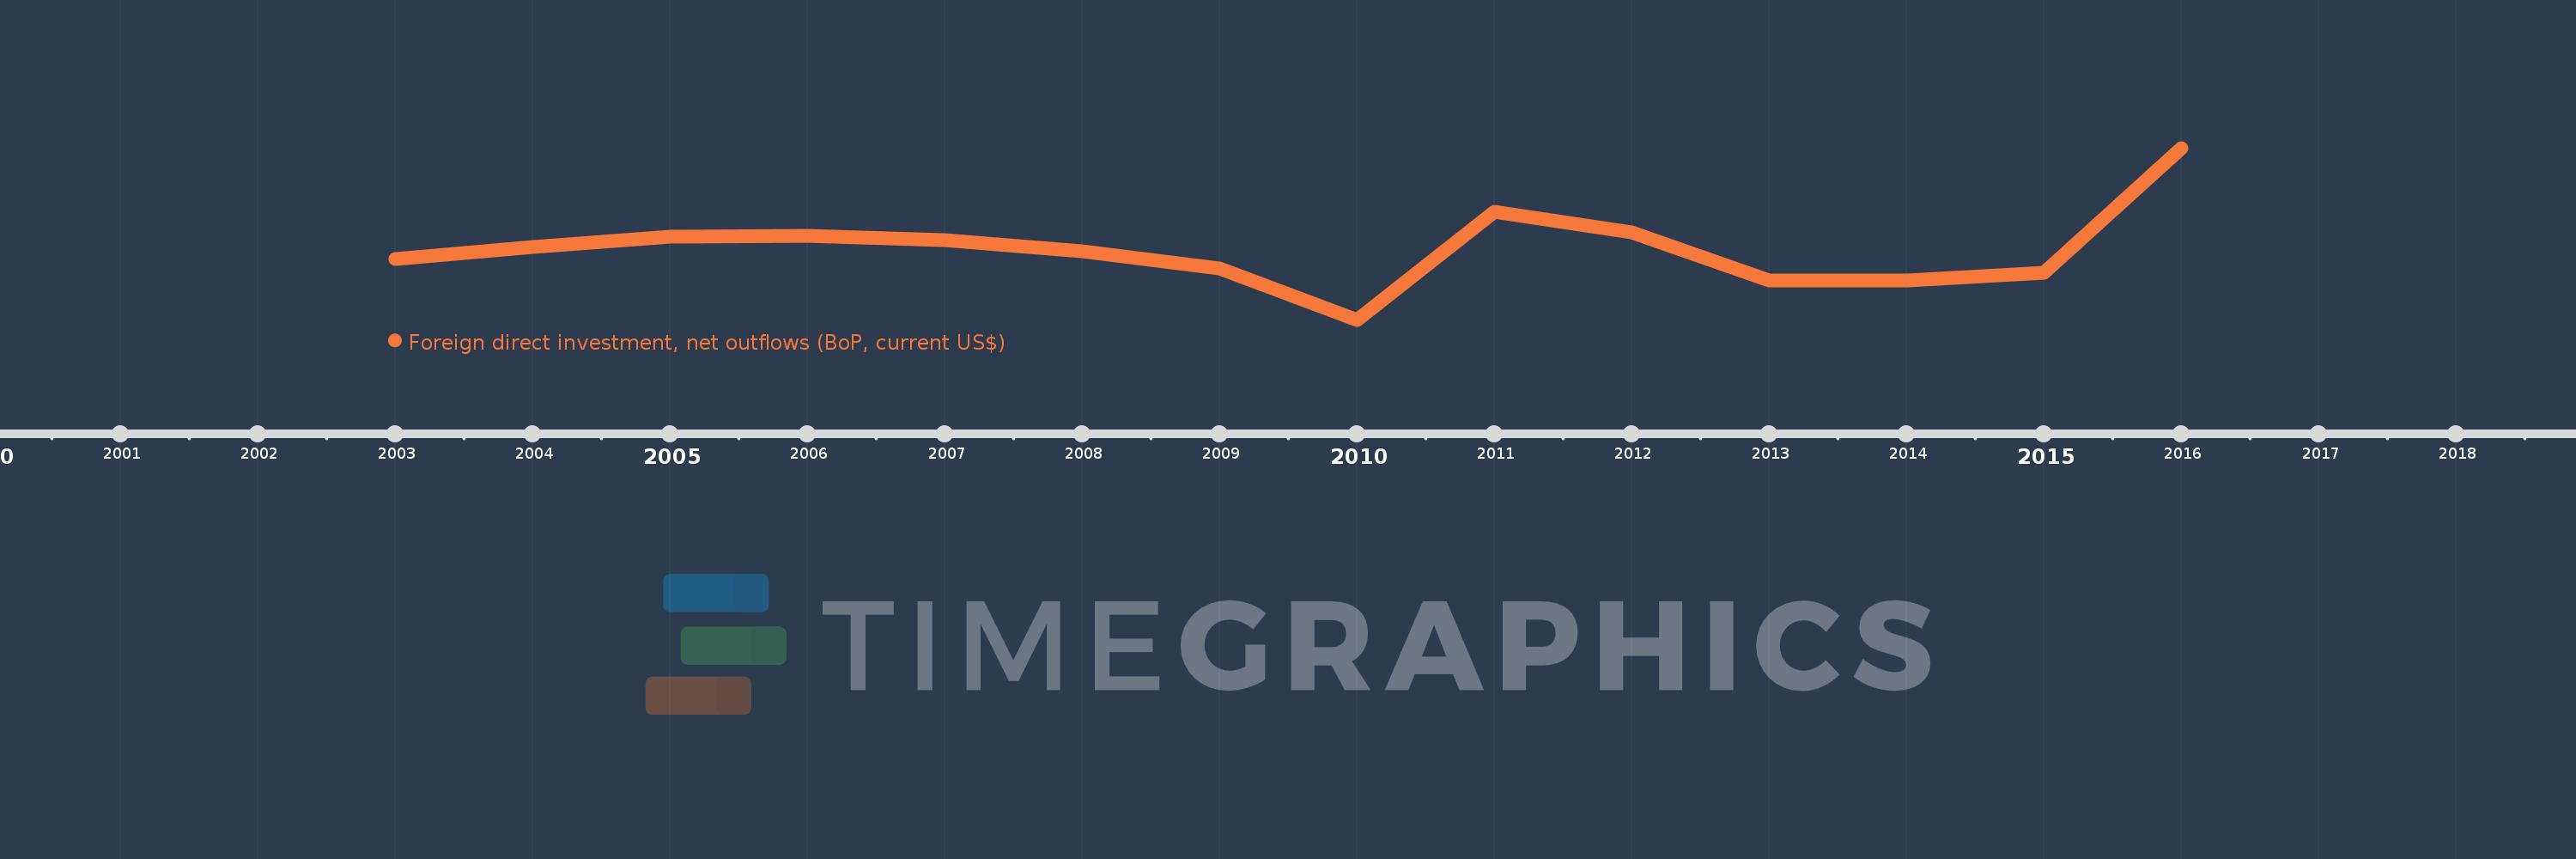
This timeline shows a graph from 2003 to 2016 of Vanuatu. No data until 2002. Number of actual observations by date: 14.
Source name:
World Development Indicators
Source organization:
International Monetary Fund, Balance of Payments database, supplemented by data from the United Nations Conference on Trade and Development and official national sources.
Categories, topics:
Economy & Growth, Financial Sector
Last updated:
apr 23, 2017
Indicators value changes by year
Meaning:
655.464K
Minimum:
50.397K
jan 1, 2010
Maximum:
1.516 mln
jan 1, 2016
At the date of observation
Value
Absolute change
Change from the previous value
jan 1, 2003
568.216K
+568.216K
0.0%
jan 1, 2004
673.111K
+104.896K
18.46%
jan 1, 2005
760.855K
+87.744K
13.04%
jan 1, 2006
769.051K
+8.196K
1.08%
jan 1, 2007
731.695K
-37.356K
-4.86%
jan 1, 2008
633.84K
-97.856K
-13.37%
jan 1, 2009
485.873K
-147.966K
-23.34%
jan 1, 2010
50.397K
-435.476K
-89.63%
jan 1, 2011
969.392K
+918.995K
1.82K%
jan 1, 2012
796.504K
-172.888K
-17.83%
jan 1, 2013
388.604K
-407.9K
-51.21%
jan 1, 2014
382.496K
-6.107K
-1.57%
jan 1, 2015
450.411K
+67.915K
17.76%
jan 1, 2016
1.516 mln
+1.066 mln
236.59%
Ranking of countries by current statistics by years