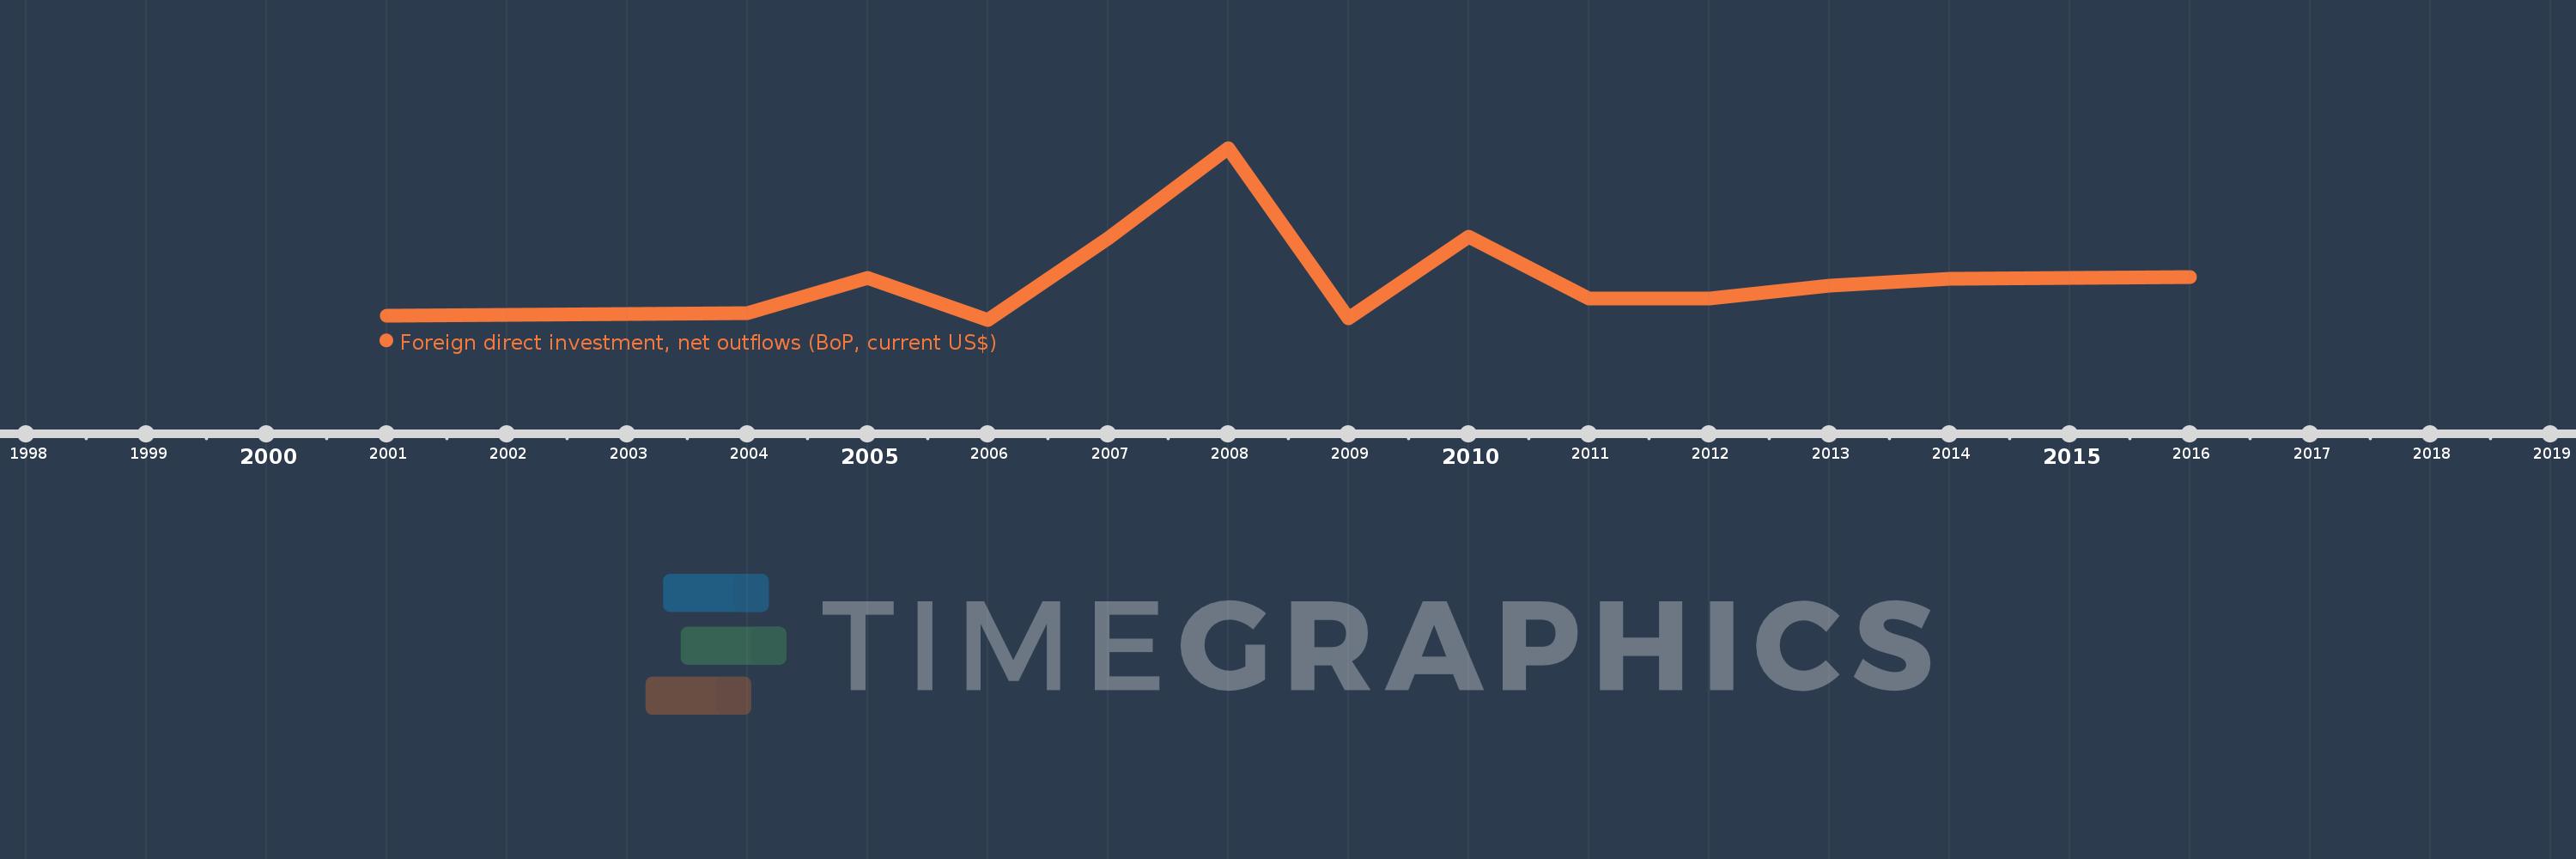
This timeline shows a graph from 2001 to 2016 of St. Vincent and the Grenadines. No data until 2000. Number of actual observations by date: 14.
Source name:
World Development Indicators
Source organization:
International Monetary Fund, Balance of Payments database, supplemented by data from the United Nations Conference on Trade and Development and official national sources.
Categories, topics:
Economy & Growth, Financial Sector
Last updated:
apr 23, 2017
Indicators value changes by year
Meaning:
381.808K
Minimum:
222.222
jan 1, 2006
Maximum:
1.552 mln
jan 1, 2008
At the date of observation
Value
Absolute change
Change from the previous value
jan 1, 2001
37.037K
+37.037K
0.0%
jan 1, 2004
62.485K
+25.448K
68.71%
jan 1, 2005
375.978K
+313.493K
501.71%
jan 1, 2006
222.222
-375.756K
-99.94%
jan 1, 2007
731.337K
+731.115K
329.0K%
jan 1, 2008
1.552 mln
+820.544K
112.2%
jan 1, 2009
12.963K
-1.539 mln
-99.16%
jan 1, 2010
746.79K
+733.827K
5.66K%
jan 1, 2011
191.7K
-555.09K
-74.33%
jan 1, 2012
191.7K
0.0
0.0%
jan 1, 2013
310.632K
+118.932K
62.04%
jan 1, 2014
370.0K
+59.368K
19.11%
jan 1, 2015
377.407K
+7.407K
2.0%
jan 1, 2016
385.185K
+7.778K
2.06%
Ranking of countries by current statistics by years