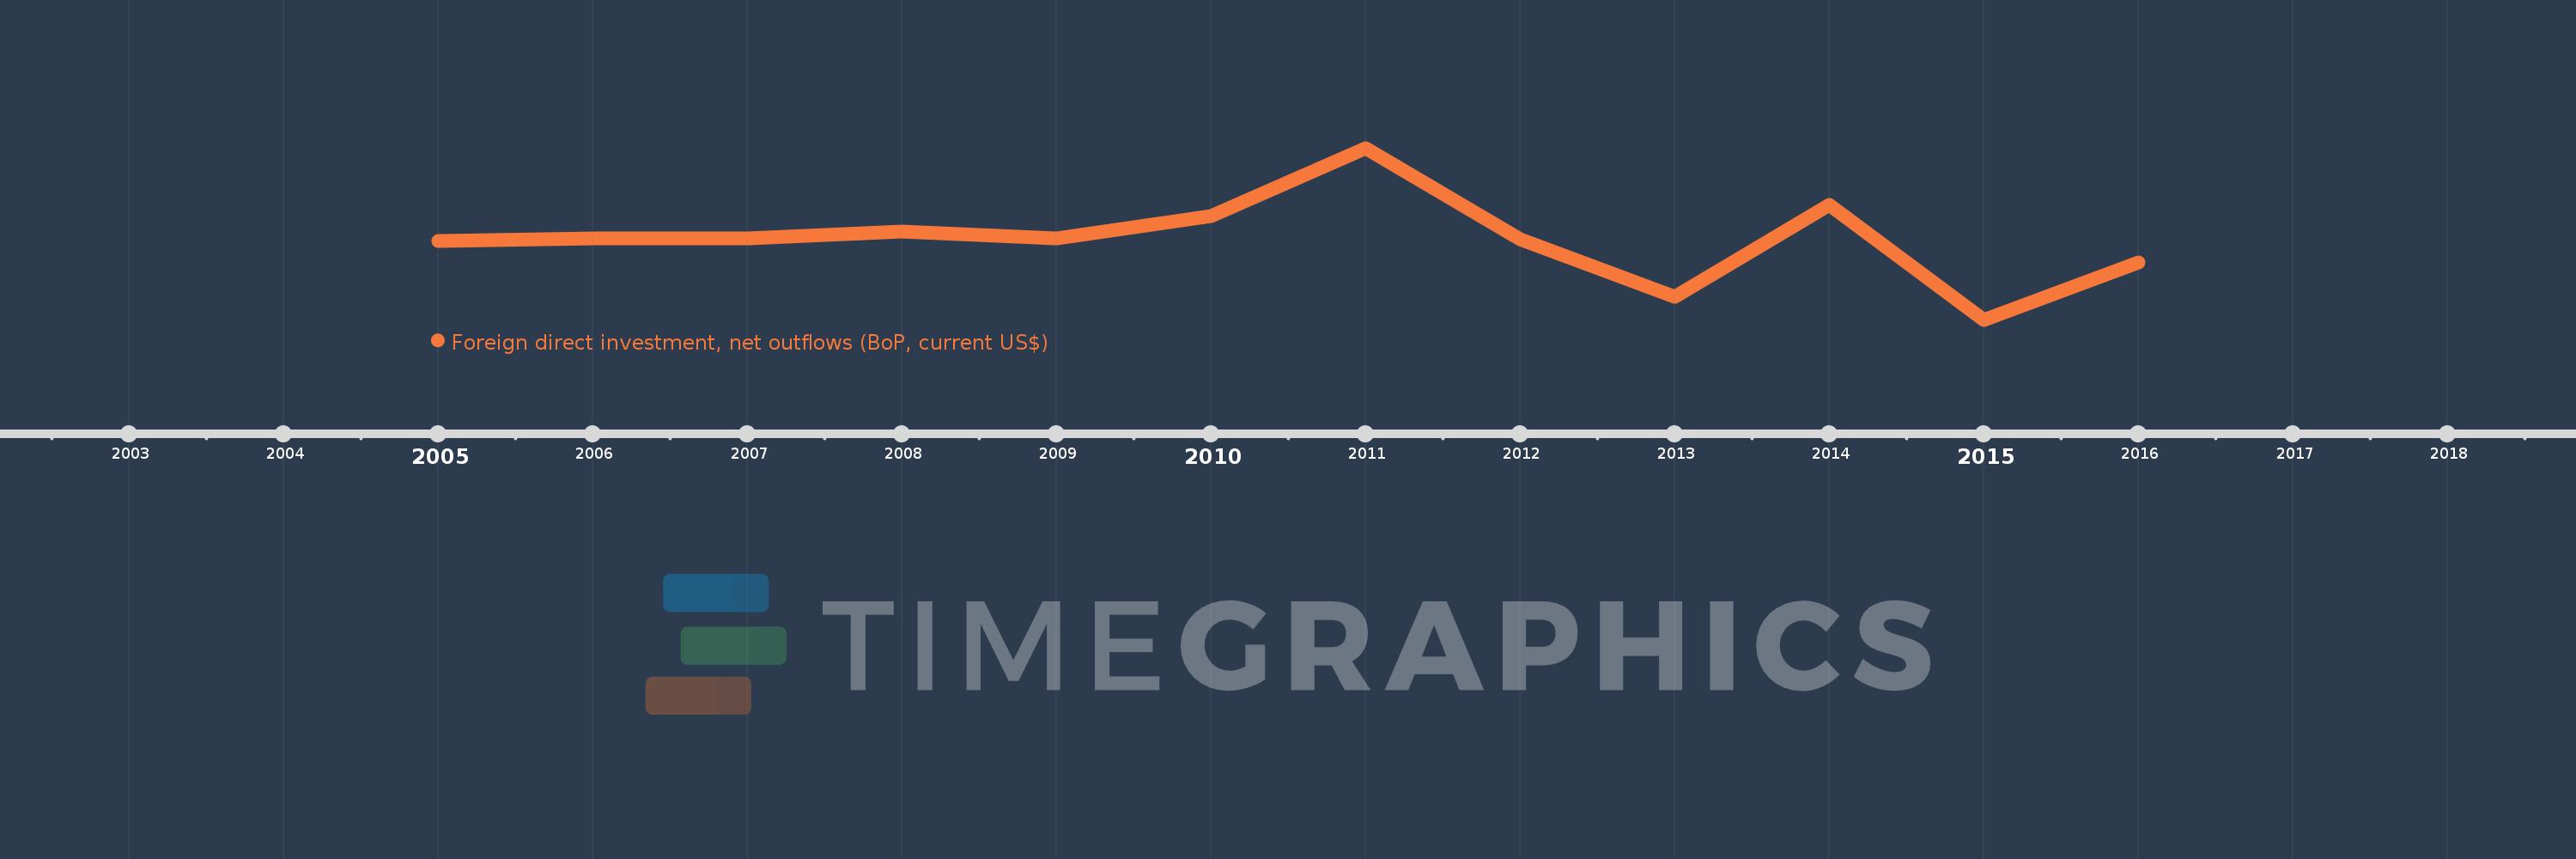
This timeline shows a graph from 2005 to 2016 of Zambia. No data until 2004. Number of actual observations by date: 12.
Source name:
World Development Indicators
Source organization:
International Monetary Fund, Balance of Payments database, supplemented by data from the United Nations Conference on Trade and Development and official national sources.
Categories, topics:
Economy & Growth, Financial Sector
Last updated:
apr 23, 2017
Indicators value changes by year
Meaning:
-10.582 mln
Minimum:
-976.0 mln
jan 1, 2015
Maximum:
1.095 bln
jan 1, 2011
At the date of observation
Value
Absolute change
Change from the previous value
jan 1, 2005
-25.0 mln
-25.0 mln
0.0%
jan 1, 2006
0.0
+25.0 mln
-100.0%
jan 1, 2007
0.0
0.0
%
jan 1, 2008
85.6 mln
+85.6 mln
%
jan 1, 2009
0.0
-85.6 mln
-100.0%
jan 1, 2010
269.558 mln
+269.558 mln
%
jan 1, 2011
1.095 bln
+825.842 mln
306.37%
jan 1, 2012
-1.4 mln
-1.097 bln
-100.13%
jan 1, 2013
-701.897 mln
-700.497 mln
50.04K%
jan 1, 2014
409.468 mln
+1.111 bln
-158.34%
jan 1, 2015
-976.0 mln
-1.385 bln
-338.36%
jan 1, 2016
-282.712 mln
+693.288 mln
-71.03%
Ranking of countries by current statistics by years