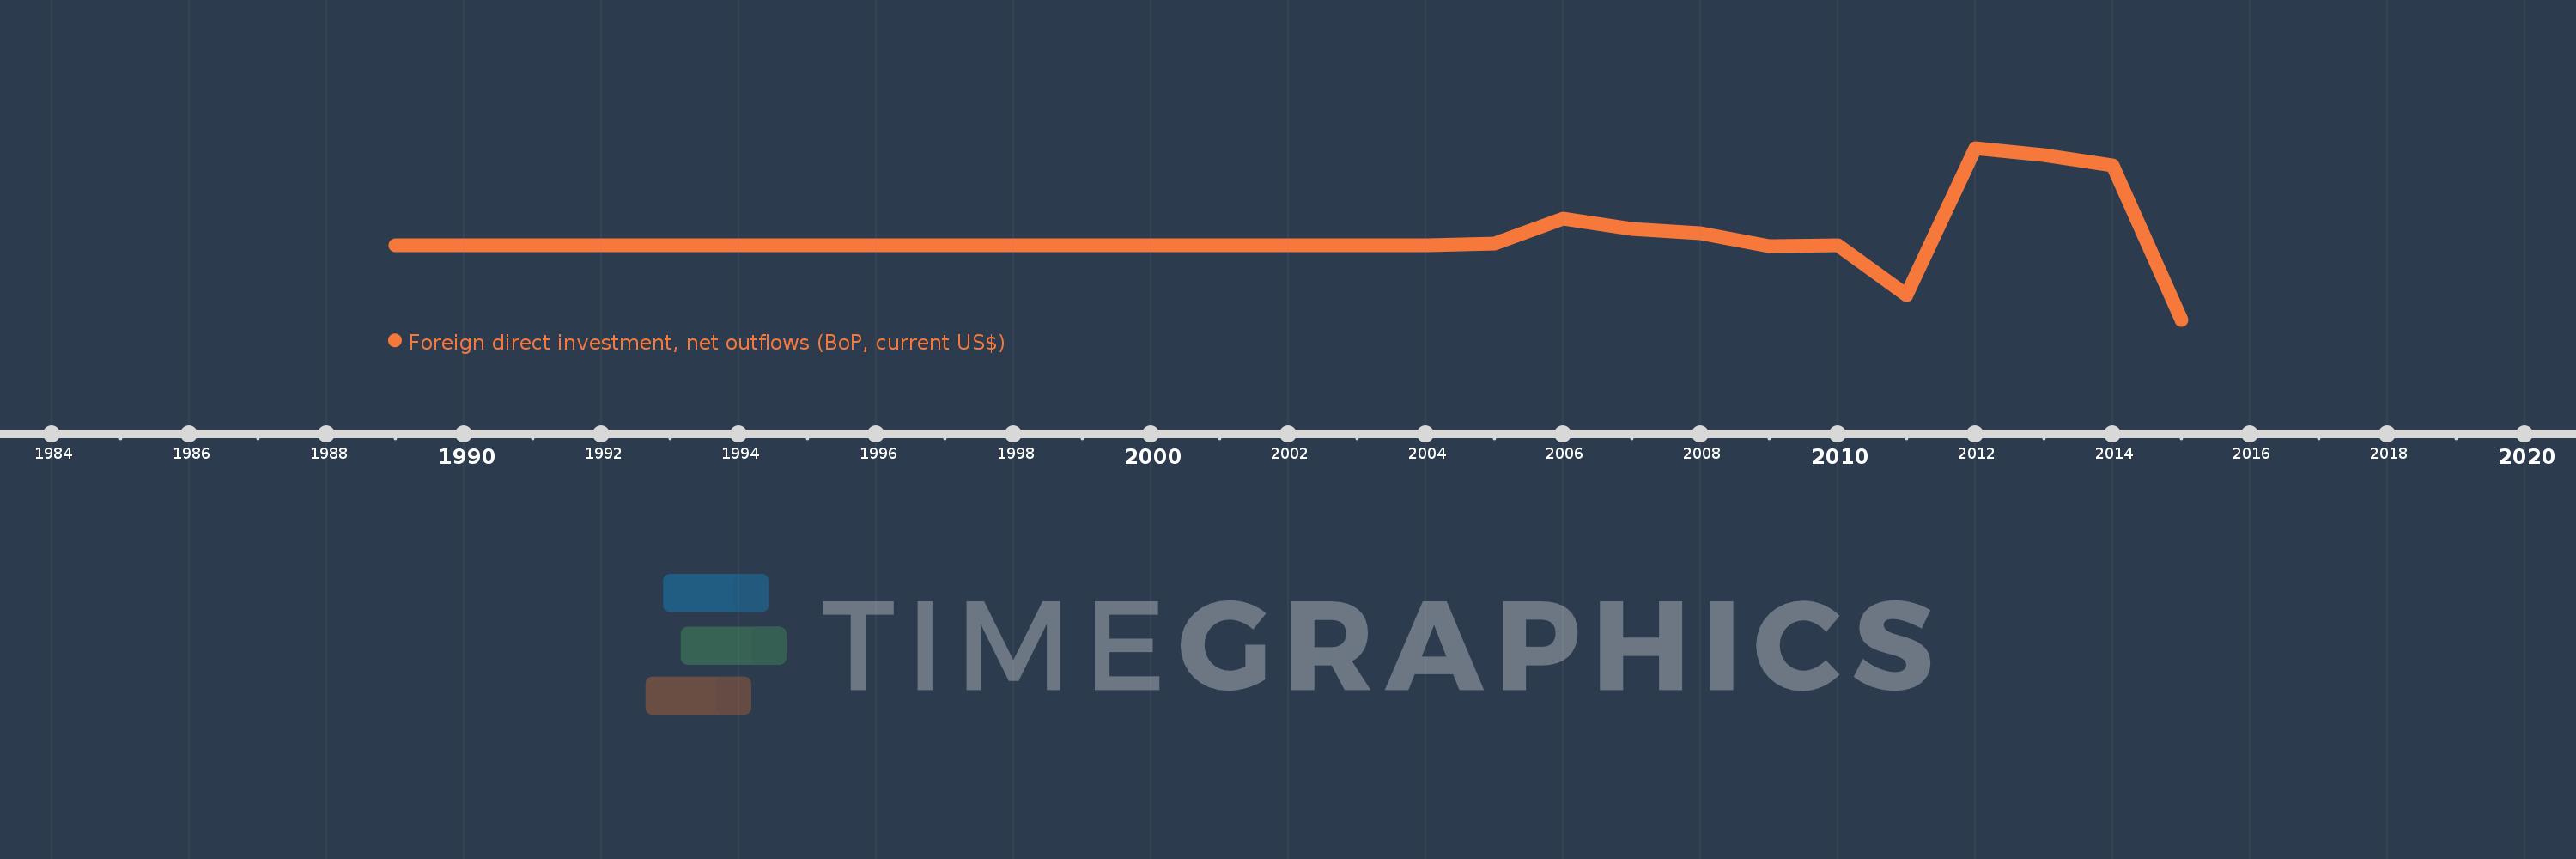
This timeline shows a graph from 1989 to 2015 of Lesotho. No data until 1988. Number of actual observations by date: 14.
Source name:
World Development Indicators
Source organization:
International Monetary Fund, Balance of Payments database, supplemented by data from the United Nations Conference on Trade and Development and official national sources.
Categories, topics:
Economy & Growth, Financial Sector
Last updated:
apr 23, 2017
Indicators value changes by year
Meaning:
6.207 mln
Minimum:
-31.36 mln
jan 1, 2015
Maximum:
41.348 mln
jan 1, 2012
At the date of observation
Value
Absolute change
Change from the previous value
jan 1, 1989
58.515K
+58.515K
0.0%
jan 1, 2003
47.906K
-10.609K
-18.13%
jan 1, 2004
1.287K
-46.62K
-97.31%
jan 1, 2005
914.082K
+912.796K
70.95K%
jan 1, 2006
11.595 mln
+10.681 mln
1.17K%
jan 1, 2007
7.244 mln
-4.351 mln
-37.52%
jan 1, 2008
5.397 mln
-1.847 mln
-25.5%
jan 1, 2009
-137.257K
-5.534 mln
-102.54%
jan 1, 2010
315.741K
+452.998K
-330.04%
jan 1, 2011
-20.91 mln
-21.226 mln
-6.72K%
jan 1, 2012
41.348 mln
+62.258 mln
-297.74%
jan 1, 2013
38.29 mln
-3.059 mln
-7.4%
jan 1, 2014
34.087 mln
-4.202 mln
-10.97%
jan 1, 2015
-31.36 mln
-65.447 mln
-192.0%
Ranking of countries by current statistics by years