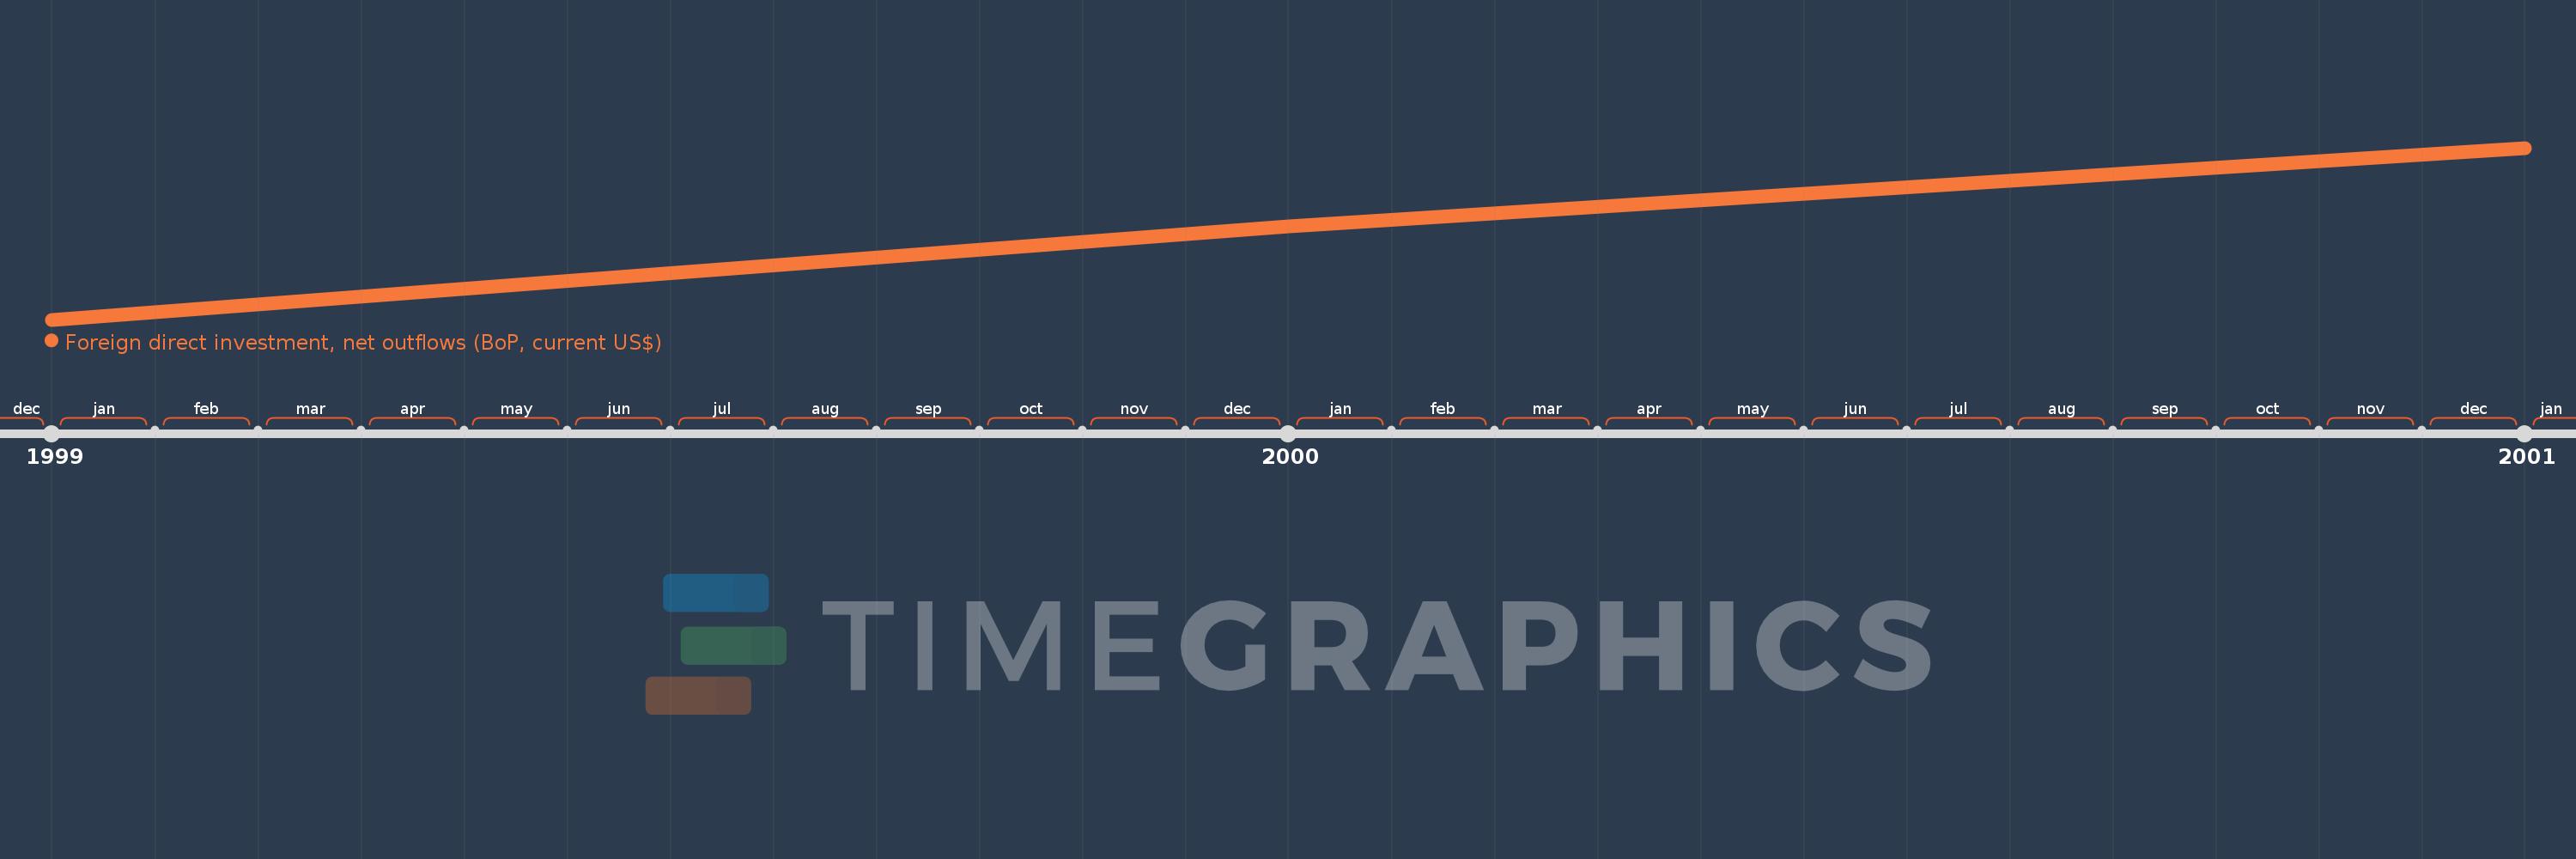
This timeline shows a graph from 1999 to 2001 of Eritrea. No data until 1998. Number of actual observations by date: 3.
Source name:
World Development Indicators
Source organization:
International Monetary Fund, Balance of Payments database, supplemented by data from the United Nations Conference on Trade and Development and official national sources.
Categories, topics:
Economy & Growth, Financial Sector
Last updated:
apr 23, 2017
Indicators value changes by year
Meaning:
-86.523 mln
Minimum:
-148.473 mln
jan 1, 1999
Maximum:
-27.876 mln
jan 1, 2001
At the date of observation
Value
Absolute change
Change from the previous value
jan 1, 1999
-148.473 mln
-148.473 mln
0.0%
jan 1, 2000
-83.222 mln
+65.251 mln
-43.95%
jan 1, 2001
-27.876 mln
+55.347 mln
-66.5%
Ranking of countries by current statistics by years