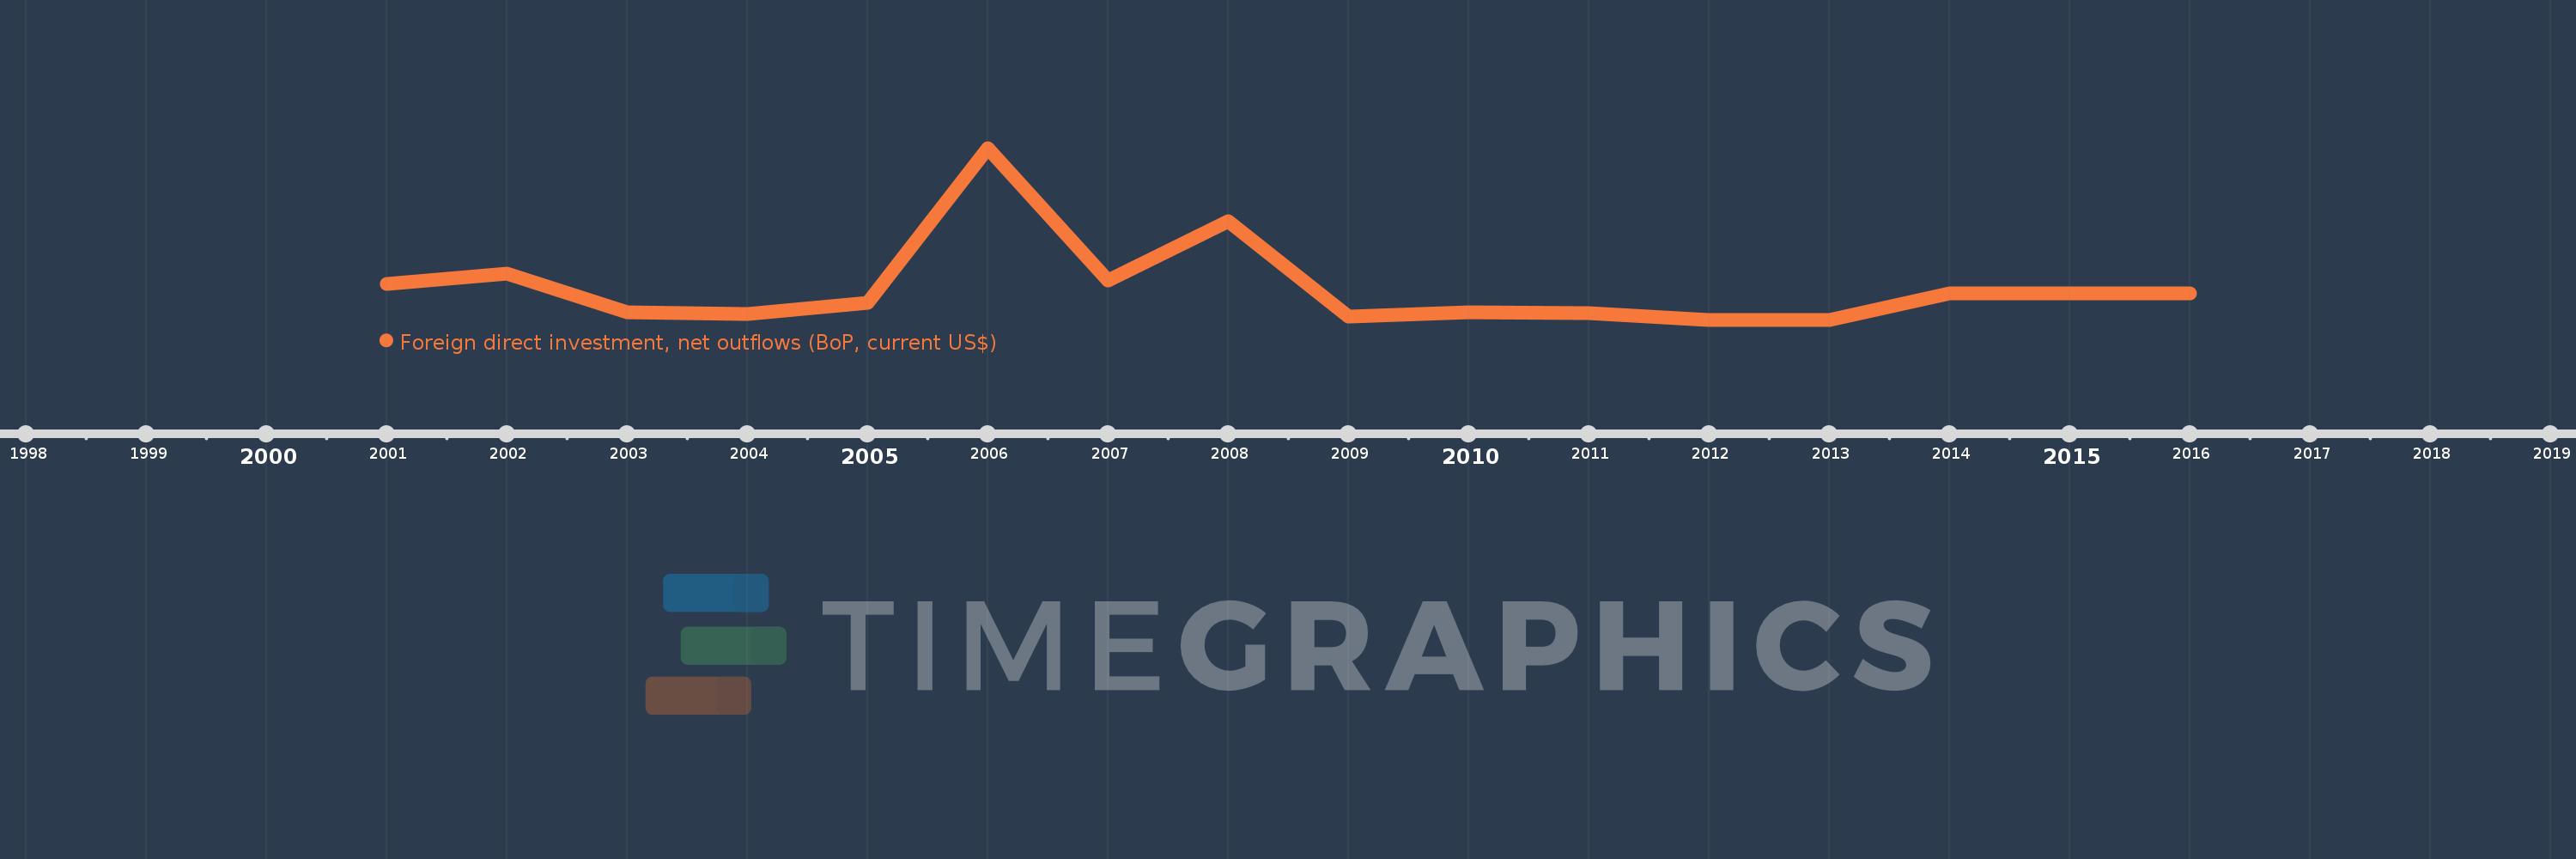
This timeline shows a graph from 2001 to 2016 of Dominica. No data until 2000. Number of actual observations by date: 16.
Source name:
World Development Indicators
Source organization:
International Monetary Fund, Balance of Payments database, supplemented by data from the United Nations Conference on Trade and Development and official national sources.
Categories, topics:
Economy & Growth, Financial Sector
Last updated:
apr 23, 2017
Indicators value changes by year
Meaning:
2.47 mln
Minimum:
25.926K
jan 1, 2012
Maximum:
12.975 mln
jan 1, 2006
At the date of observation
Value
Absolute change
Change from the previous value
jan 1, 2001
2.752 mln
+2.752 mln
0.0%
jan 1, 2002
3.517 mln
+765.556K
27.82%
jan 1, 2003
581.852K
-2.936 mln
-83.46%
jan 1, 2004
471.481K
-110.37K
-18.97%
jan 1, 2005
1.285 mln
+813.256K
172.49%
jan 1, 2006
12.975 mln
+11.69 mln
909.93%
jan 1, 2007
2.999 mln
-9.976 mln
-76.89%
jan 1, 2008
7.428 mln
+4.429 mln
147.72%
jan 1, 2009
263.393K
-7.164 mln
-96.45%
jan 1, 2010
611.596K
+348.204K
132.2%
jan 1, 2011
523.379K
-88.217K
-14.42%
jan 1, 2012
25.926K
-497.453K
-95.05%
jan 1, 2013
35.489K
+9.563K
36.89%
jan 1, 2014
2.012 mln
+1.976 mln
5.57K%
jan 1, 2015
2.043 mln
+30.741K
1.53%
jan 1, 2016
2.003 mln
-39.63K
-1.94%
Ranking of countries by current statistics by years