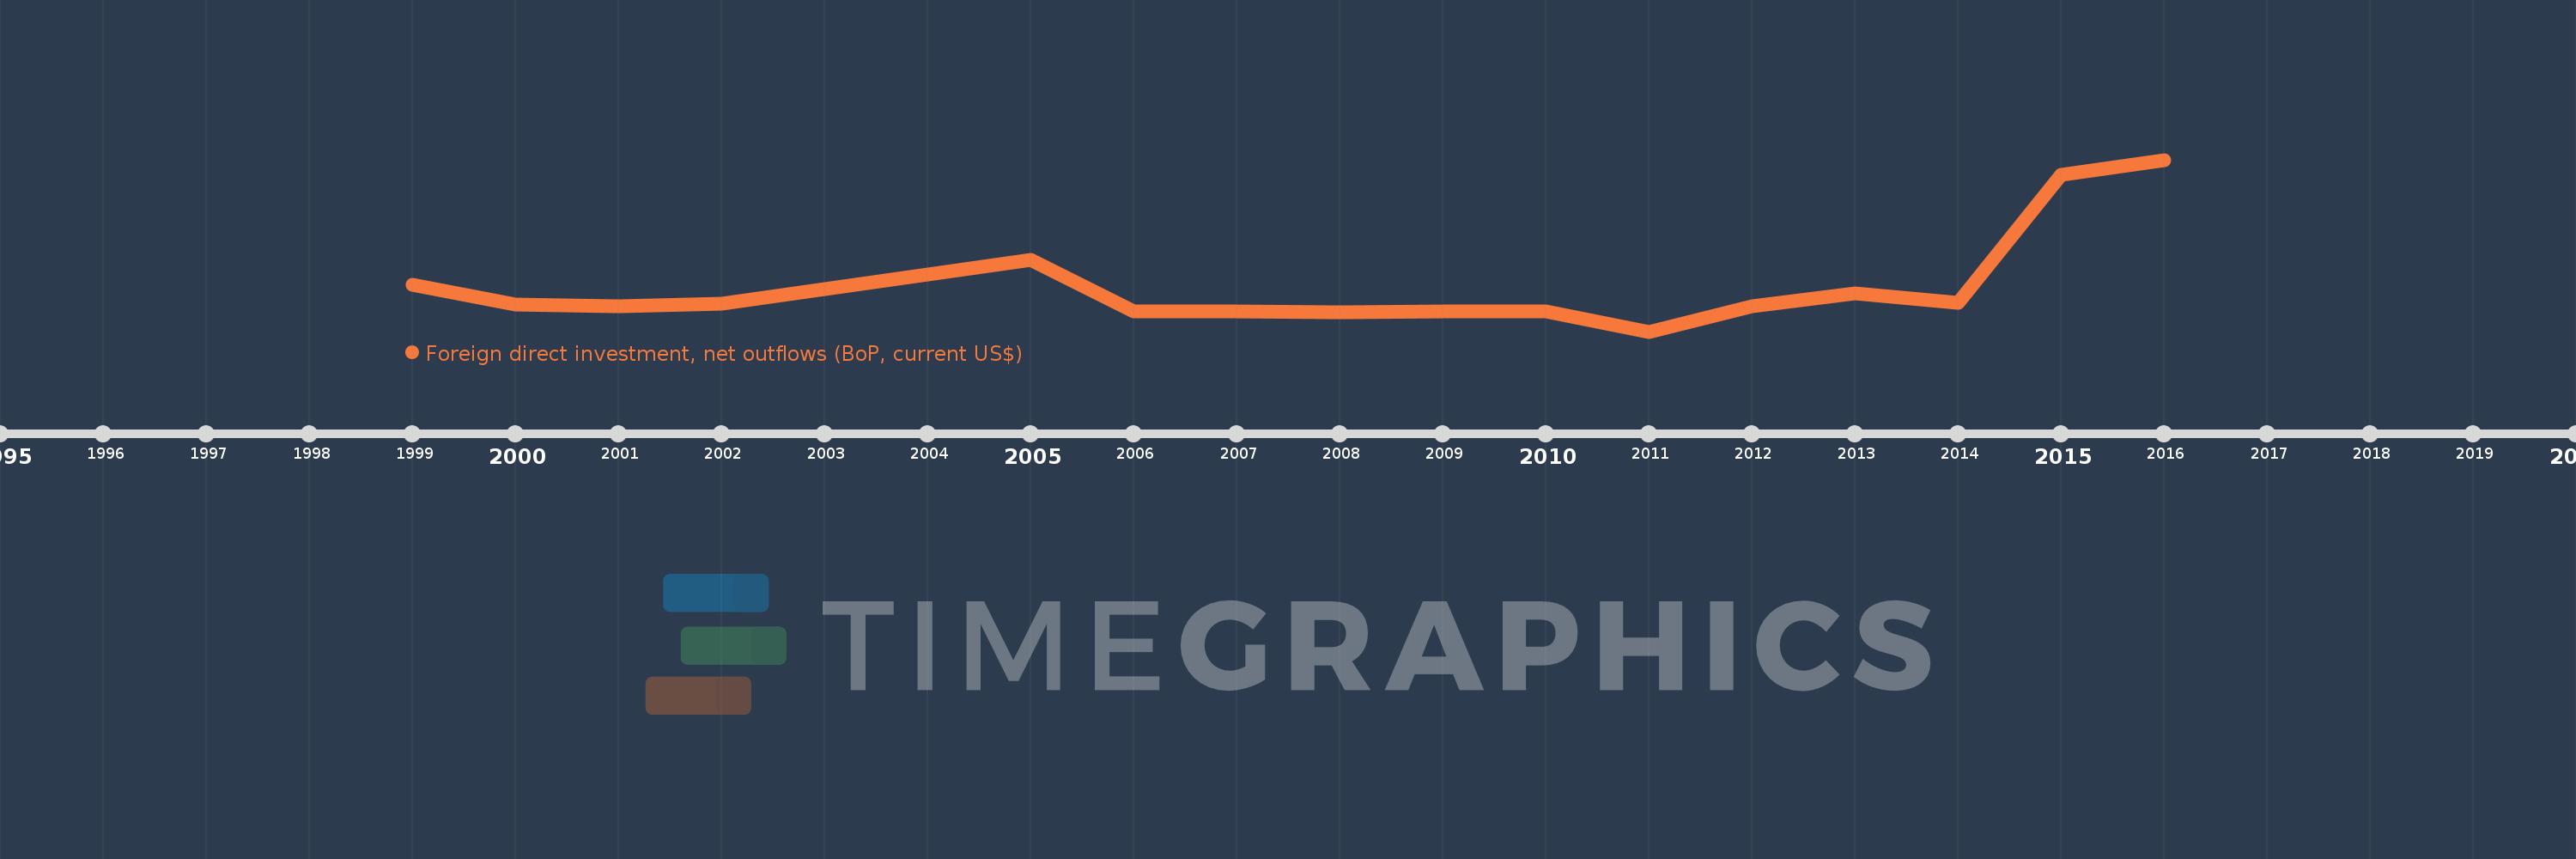
This timeline shows a graph from 1999 to 2016 of Kyrgyz Republic. No data until 1998. Number of actual observations by date: 16.
Source name:
World Development Indicators
Source organization:
International Monetary Fund, Balance of Payments database, supplemented by data from the United Nations Conference on Trade and Development and official national sources.
Categories, topics:
Economy & Growth, Financial Sector
Last updated:
apr 23, 2017
Indicators value changes by year
Meaning:
21.156 mln
Minimum:
-17.566 mln
jan 1, 2011
Maximum:
130.167 mln
jan 1, 2016
At the date of observation
Value
Absolute change
Change from the previous value
jan 1, 1999
22.622 mln
+22.622 mln
0.0%
jan 1, 2000
6.059 mln
-16.563 mln
-73.22%
jan 1, 2001
4.5 mln
-1.559 mln
-25.73%
jan 1, 2002
6.1 mln
+1.6 mln
35.56%
jan 1, 2005
43.932 mln
+37.832 mln
620.2%
jan 1, 2006
0.0
-43.932 mln
-100.0%
jan 1, 2007
0.0
0.0
%
jan 1, 2008
-1.023 mln
-1.023 mln
%
jan 1, 2009
-127.939K
+894.911K
-87.49%
jan 1, 2010
-267.2K
-139.261K
108.85%
jan 1, 2011
-17.566 mln
-17.299 mln
6.47K%
jan 1, 2012
3.945 mln
+21.511 mln
-122.46%
jan 1, 2013
15.604 mln
+11.659 mln
295.54%
jan 1, 2014
7.029 mln
-8.575 mln
-54.95%
jan 1, 2015
117.518 mln
+110.489 mln
1.57K%
jan 1, 2016
130.167 mln
+12.649 mln
10.76%
Ranking of countries by current statistics by years