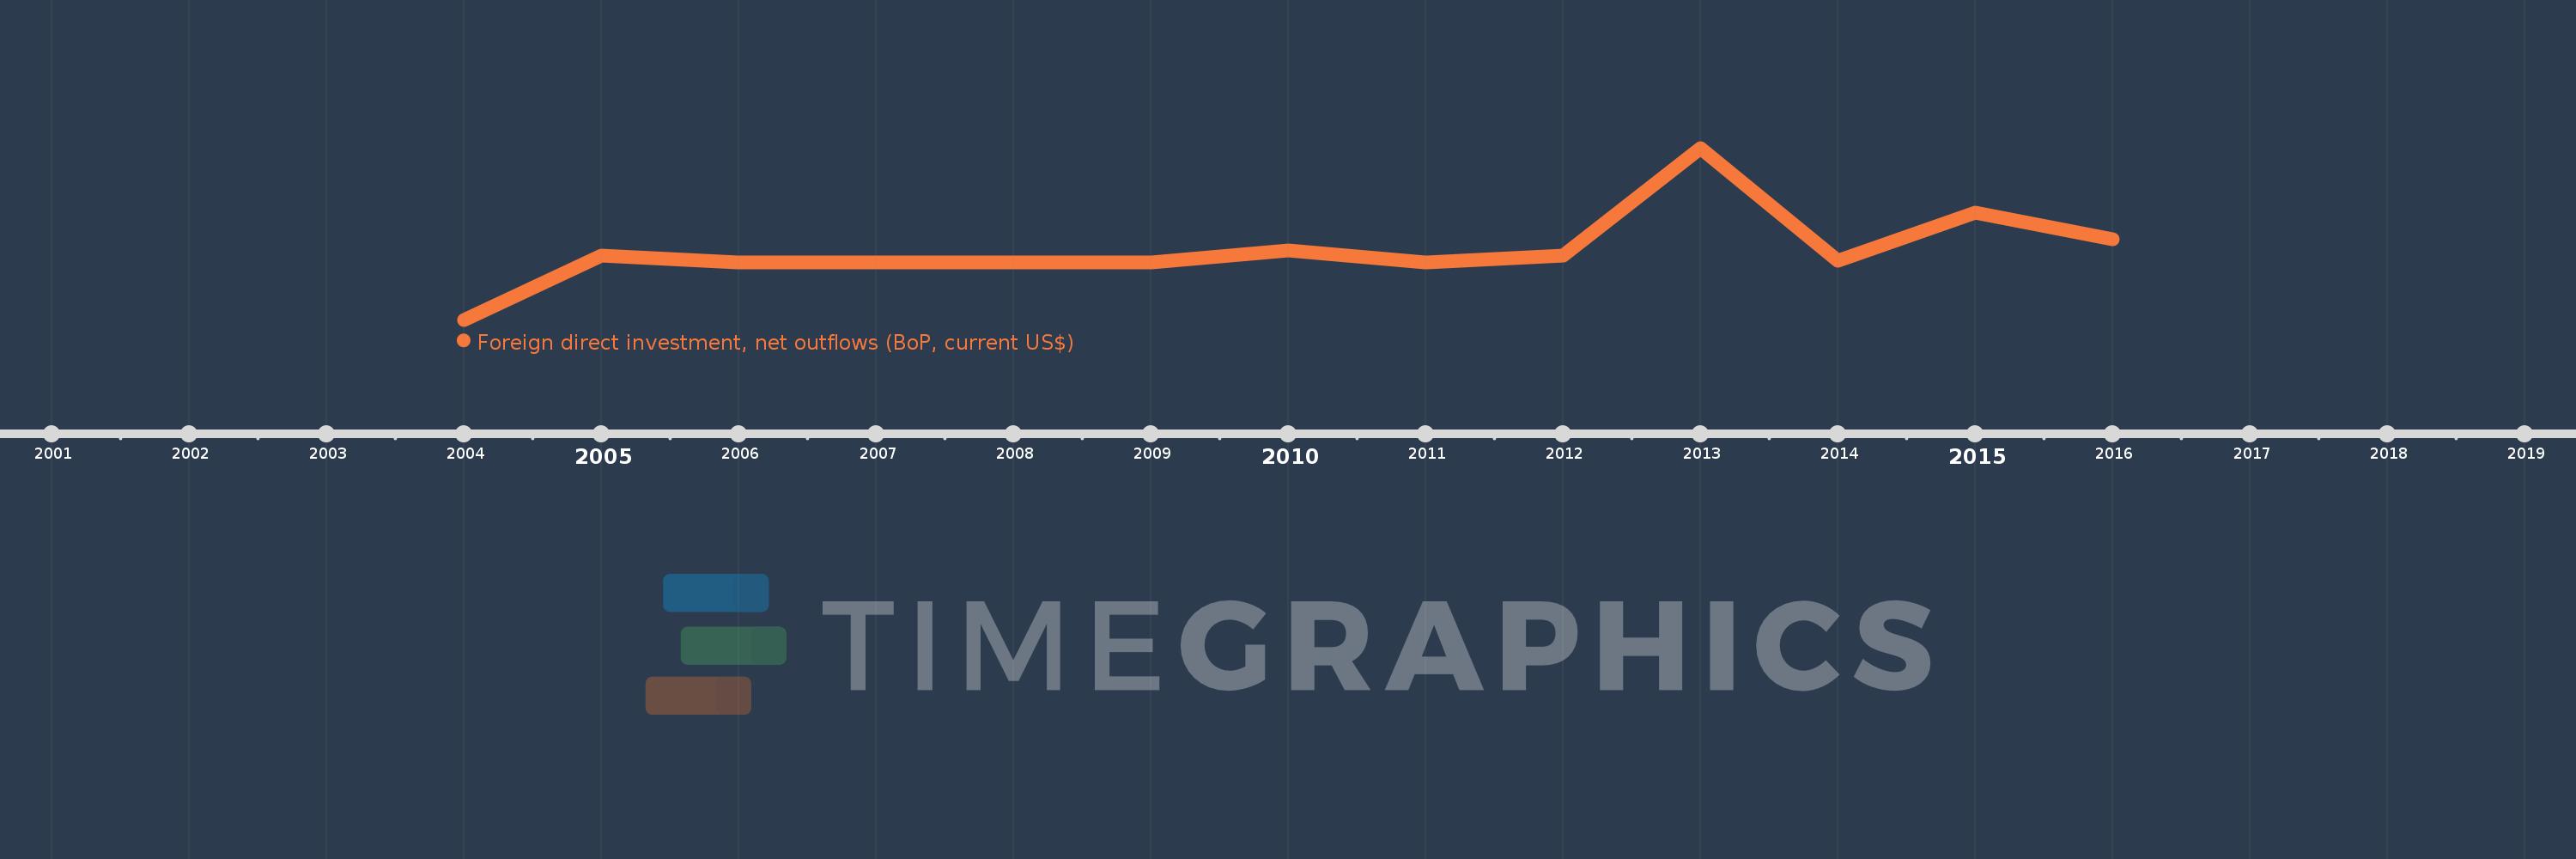
This timeline shows a graph from 2004 to 2016 of Samoa. No data until 2003. Number of actual observations by date: 13.
Source name:
World Development Indicators
Source organization:
International Monetary Fund, Balance of Payments database, supplemented by data from the United Nations Conference on Trade and Development and official national sources.
Categories, topics:
Economy & Growth, Financial Sector
Last updated:
apr 23, 2017
Indicators value changes by year
Meaning:
1.046 mln
Minimum:
-5.045 mln
jan 1, 2004
Maximum:
10.001 mln
jan 1, 2013
At the date of observation
Value
Absolute change
Change from the previous value
jan 1, 2004
-5.045 mln
-5.045 mln
0.0%
jan 1, 2005
606.098K
+5.651 mln
-112.01%
jan 1, 2006
0.0
-606.098K
-100.0%
jan 1, 2007
0.0
0.0
%
jan 1, 2008
0.0
0.0
%
jan 1, 2009
0.0
0.0
%
jan 1, 2010
995.202K
+995.202K
%
jan 1, 2011
0.0
-995.202K
-100.0%
jan 1, 2012
600.814K
+600.814K
%
jan 1, 2013
10.001 mln
+9.4 mln
1.56K%
jan 1, 2014
98.677K
-9.903 mln
-99.01%
jan 1, 2015
4.329 mln
+4.23 mln
4.29K%
jan 1, 2016
2.013 mln
-2.316 mln
-53.5%
Ranking of countries by current statistics by years