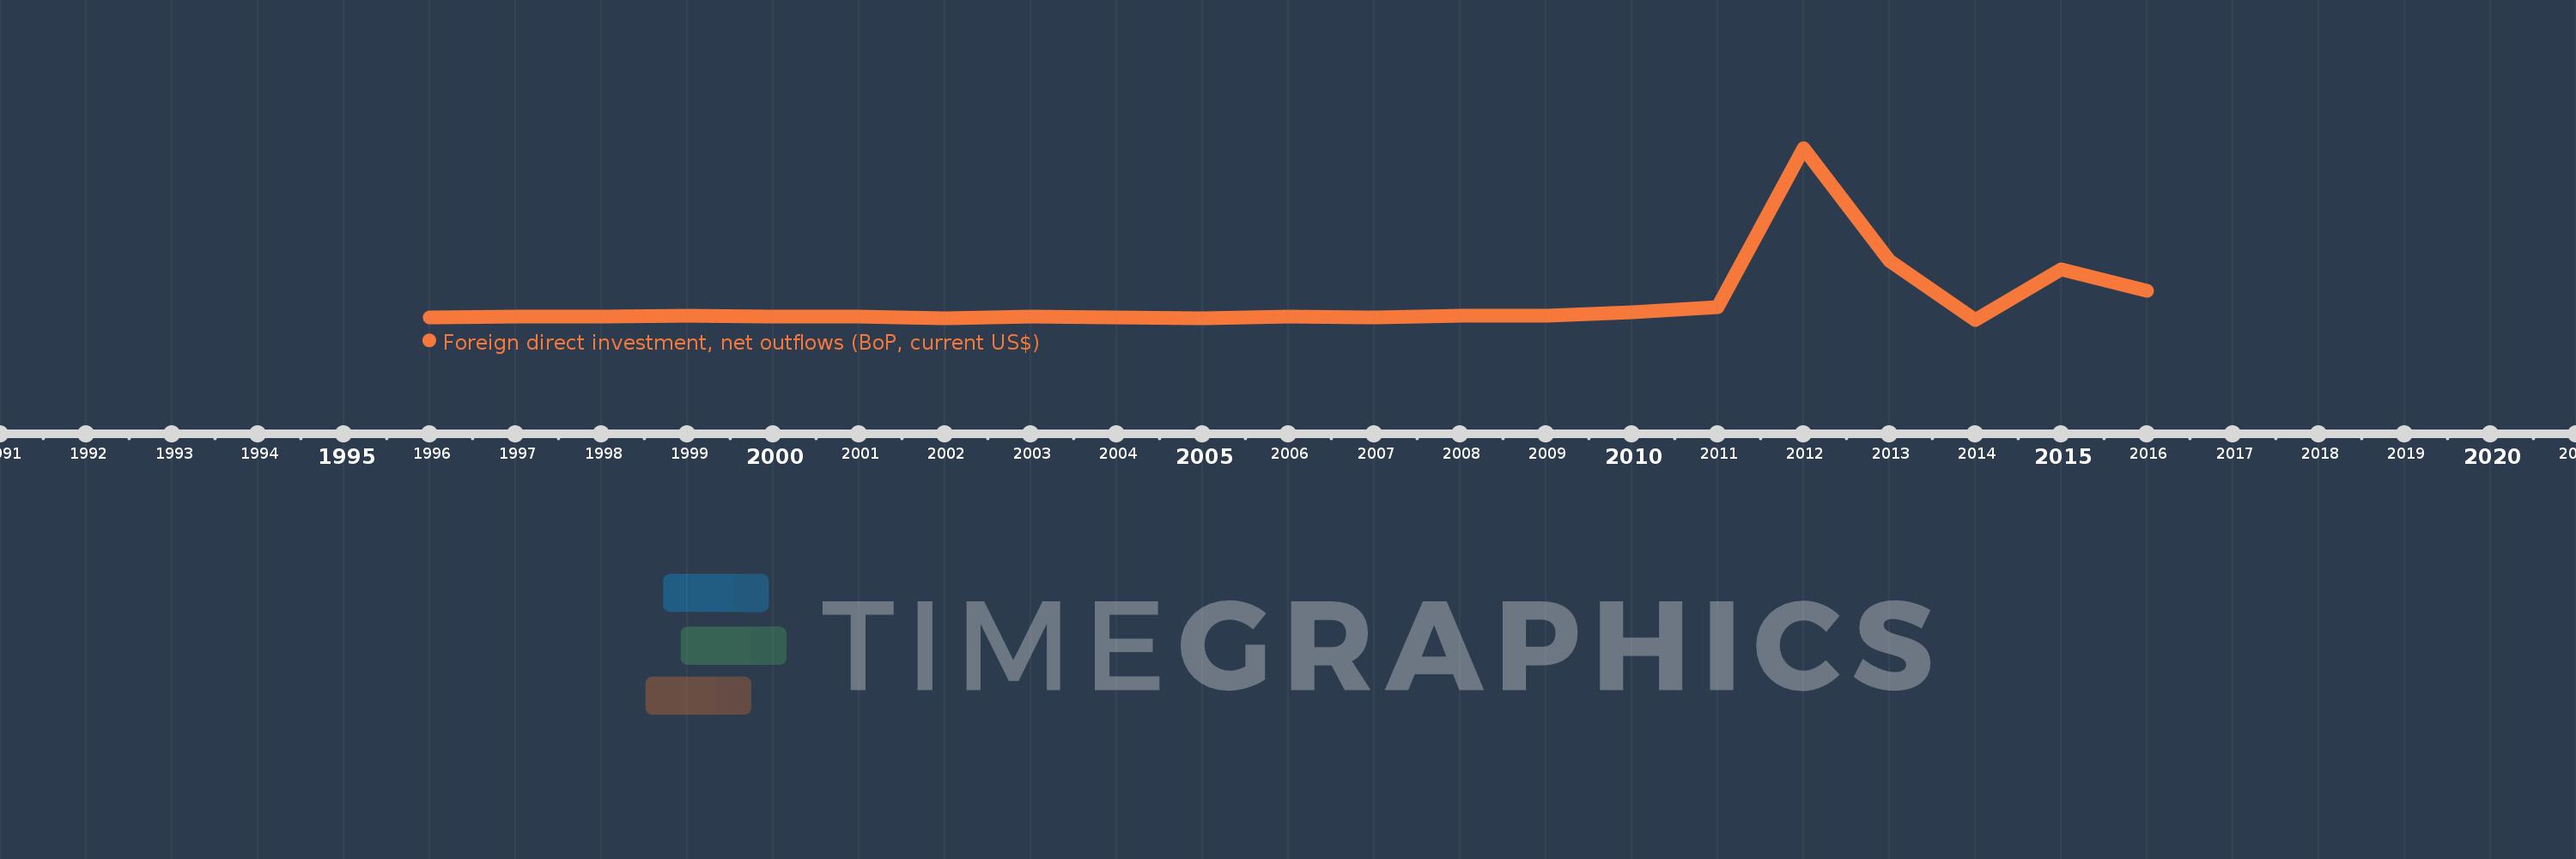
This timeline shows a graph from 1996 to 2016 of Togo. No data until 1995. Number of actual observations by date: 21.
Source name:
World Development Indicators
Source organization:
International Monetary Fund, Balance of Payments database, supplemented by data from the United Nations Conference on Trade and Development and official national sources.
Categories, topics:
Economy & Growth, Financial Sector
Last updated:
apr 23, 2017
Indicators value changes by year
Meaning:
111.856 mln
Minimum:
-20.674 mln
jan 1, 2014
Maximum:
1.265 bln
jan 1, 2012
At the date of observation
Value
Absolute change
Change from the previous value
jan 1, 1996
-5.798 mln
-5.798 mln
0.0%
jan 1, 1997
2.784 mln
+8.582 mln
-148.02%
jan 1, 1998
2.45 mln
-334.0K
-12.0%
jan 1, 1999
10.594 mln
+8.144 mln
332.41%
jan 1, 2000
2.886 mln
-7.708 mln
-72.76%
jan 1, 2001
449.453K
-2.437 mln
-84.43%
jan 1, 2002
-7.252 mln
-7.701 mln
-1.71K%
jan 1, 2003
2.366 mln
+9.618 mln
-132.62%
jan 1, 2004
-6.335 mln
-8.701 mln
-367.77%
jan 1, 2005
-12.577 mln
-6.241 mln
98.52%
jan 1, 2006
4.102 mln
+16.678 mln
-132.61%
jan 1, 2007
-422.651K
-4.524 mln
-110.3%
jan 1, 2008
12.459 mln
+12.881 mln
-3.05K%
jan 1, 2009
10.866 mln
-1.592 mln
-12.78%
jan 1, 2010
35.005 mln
+24.139 mln
222.14%
jan 1, 2011
76.301 mln
+41.296 mln
117.97%
jan 1, 2012
1.265 bln
+1.188 bln
1.56K%
jan 1, 2013
420.33 mln
-844.219 mln
-66.76%
jan 1, 2014
-20.674 mln
-441.004 mln
-104.92%
jan 1, 2015
358.493 mln
+379.167 mln
-1.83K%
jan 1, 2016
198.397 mln
-160.095 mln
-44.66%
Ranking of countries by current statistics by years