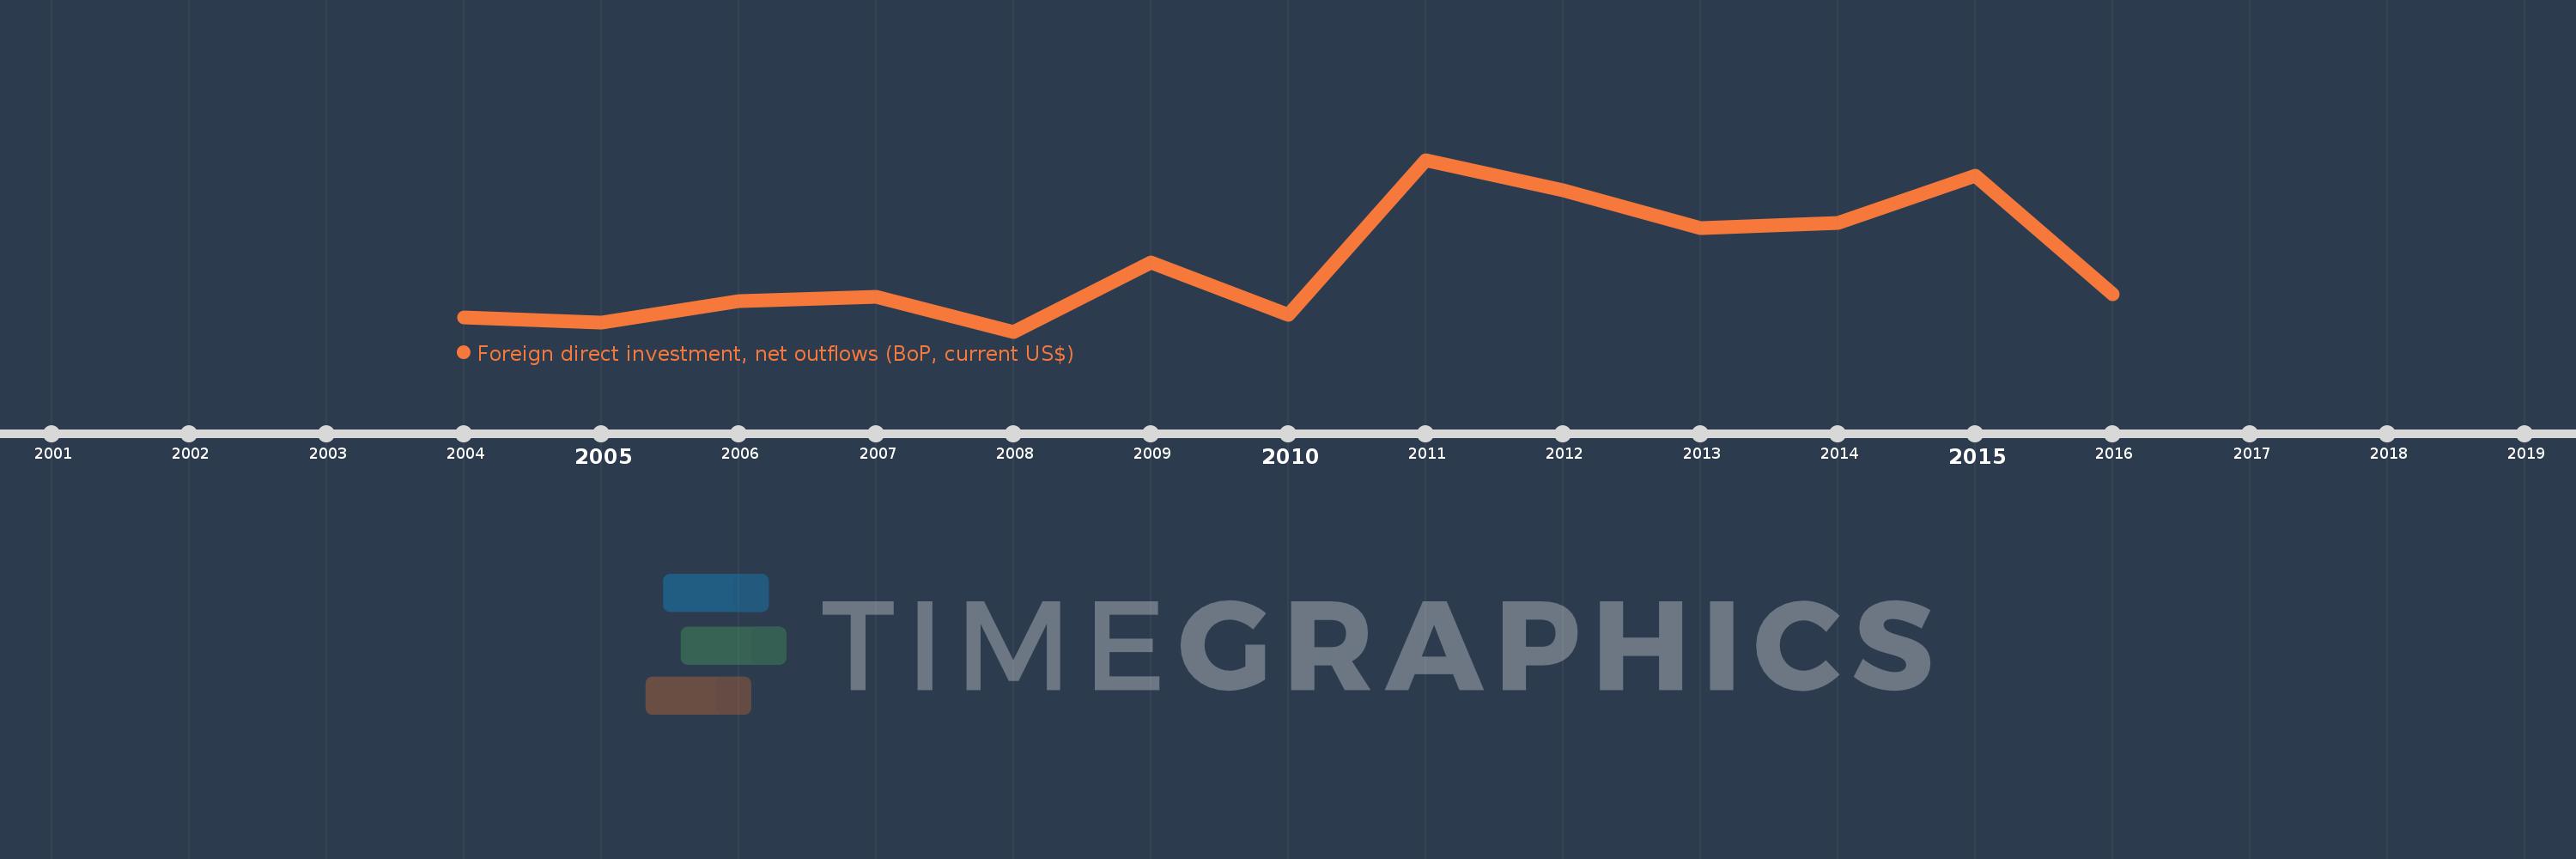
This timeline shows a graph from 2004 to 2016 of Oman. No data until 2003. Number of actual observations by date: 13.
Source name:
World Development Indicators
Source organization:
International Monetary Fund, Balance of Payments database, supplemented by data from the United Nations Conference on Trade and Development and official national sources.
Categories, topics:
Economy & Growth, Financial Sector
Last updated:
apr 23, 2017
Indicators value changes by year
Meaning:
575.769 mln
Minimum:
-37.191 mln
jan 1, 2008
Maximum:
1.498 bln
jan 1, 2011
At the date of observation
Value
Absolute change
Change from the previous value
jan 1, 2004
88.0 mln
+88.0 mln
0.0%
jan 1, 2005
42.0 mln
-46.0 mln
-52.27%
jan 1, 2006
233.55 mln
+191.55 mln
456.07%
jan 1, 2007
274.642 mln
+41.092 mln
17.59%
jan 1, 2008
-37.191 mln
-311.834 mln
-113.54%
jan 1, 2009
584.395 mln
+621.586 mln
-1.67K%
jan 1, 2010
109.233 mln
-475.163 mln
-81.31%
jan 1, 2011
1.498 bln
+1.389 bln
1.27K%
jan 1, 2012
1.223 bln
-275.163 mln
-18.37%
jan 1, 2013
885.046 mln
-337.841 mln
-27.63%
jan 1, 2014
933.68 mln
+48.635 mln
5.5%
jan 1, 2015
1.356 bln
+422.627 mln
45.26%
jan 1, 2016
294.402 mln
-1.062 bln
-78.29%
Ranking of countries by current statistics by years