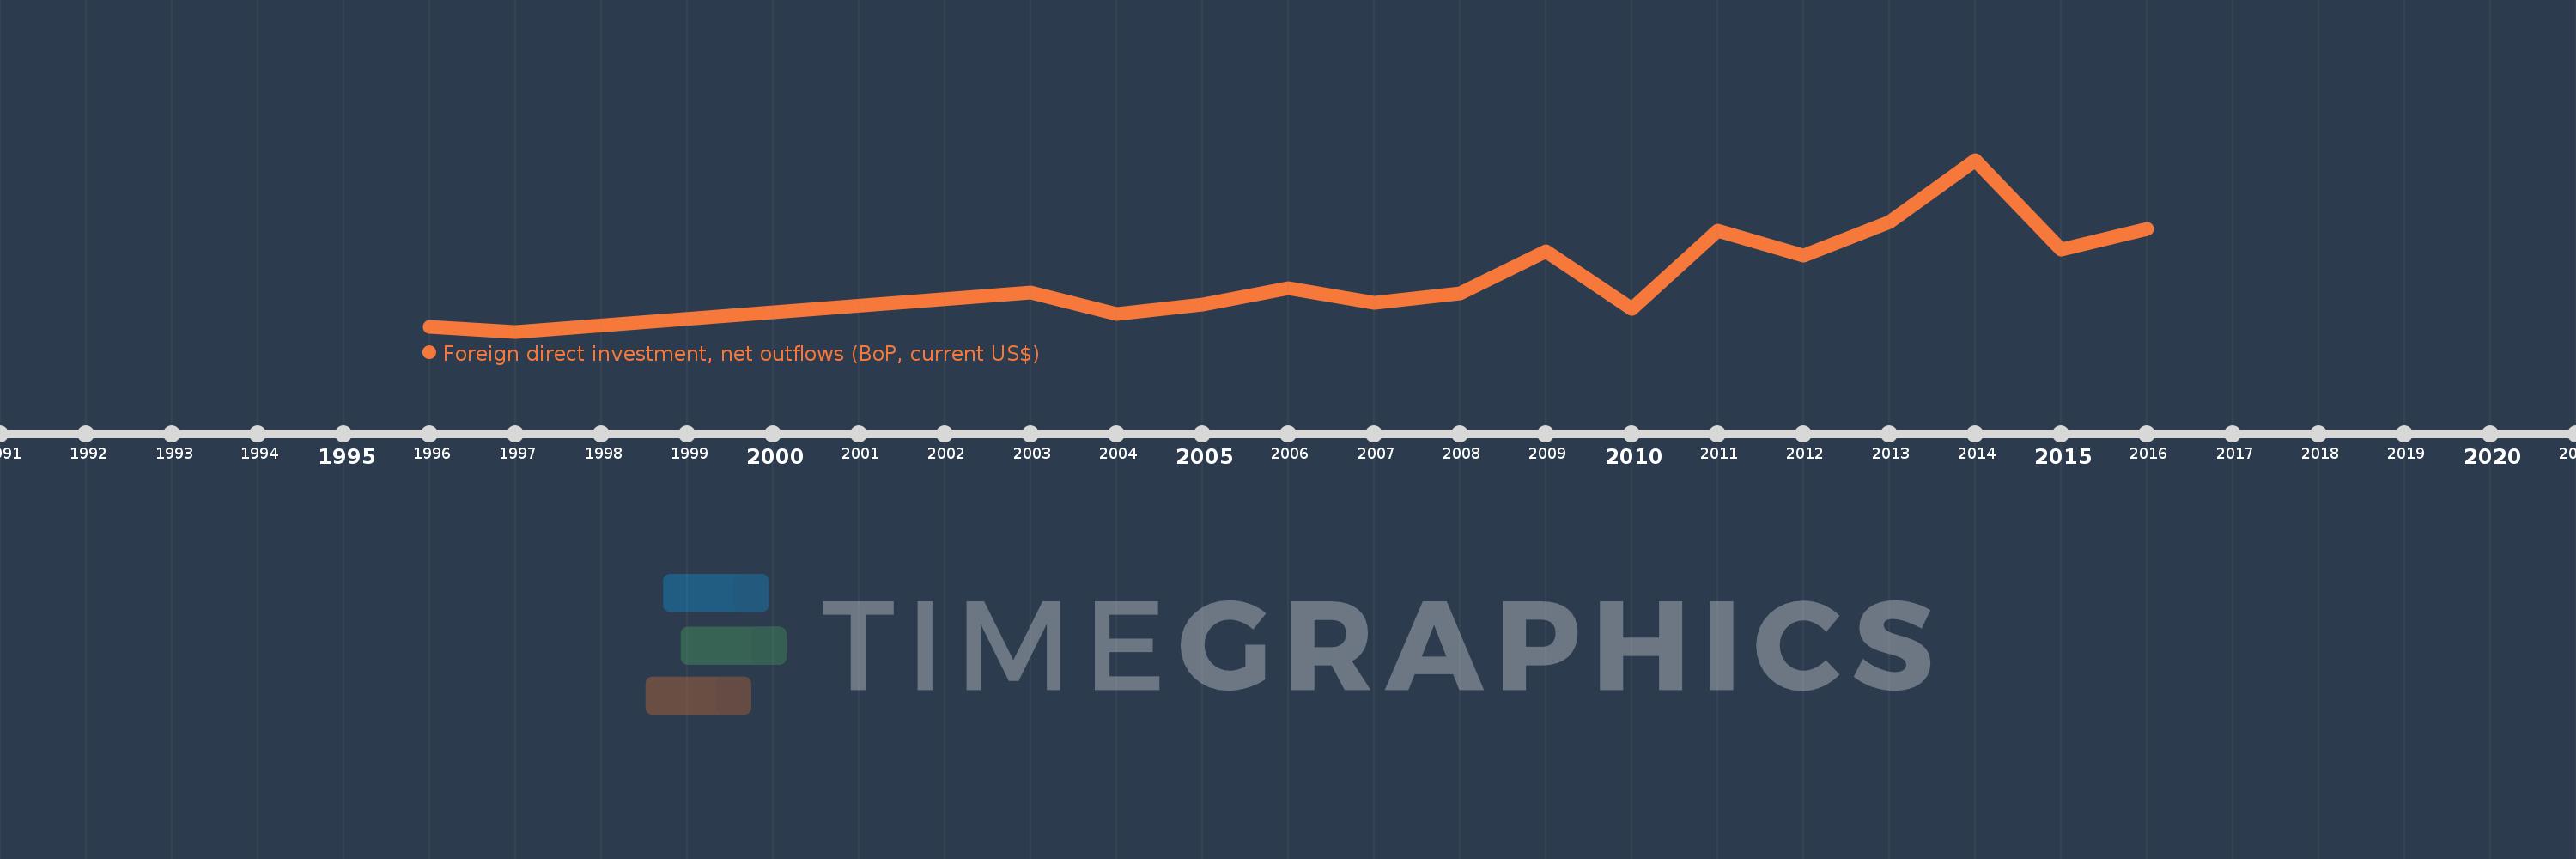
This timeline shows a graph from 1996 to 2016 of French Polynesia. No data until 1995. Number of actual observations by date: 16.
Source name:
World Development Indicators
Source organization:
International Monetary Fund, Balance of Payments database, supplemented by data from the United Nations Conference on Trade and Development and official national sources.
Categories, topics:
Economy & Growth, Financial Sector
Last updated:
apr 23, 2017
Indicators value changes by year
Meaning:
21.727 mln
Minimum:
-970.105K
jan 1, 1997
Maximum:
65.065 mln
jan 1, 2014
At the date of observation
Value
Absolute change
Change from the previous value
jan 1, 1996
1000.0K
+1000.0K
0.0%
jan 1, 1997
-970.105K
-1.97 mln
-197.01%
jan 1, 2003
14.03 mln
+15.001 mln
-1.55K%
jan 1, 2004
5.665 mln
-8.365 mln
-59.62%
jan 1, 2005
9.281 mln
+3.616 mln
63.83%
jan 1, 2006
15.755 mln
+6.474 mln
69.75%
jan 1, 2007
10.213 mln
-5.542 mln
-35.18%
jan 1, 2008
13.691 mln
+3.478 mln
34.05%
jan 1, 2009
29.968 mln
+16.277 mln
118.89%
jan 1, 2010
7.794 mln
-22.174 mln
-73.99%
jan 1, 2011
37.803 mln
+30.009 mln
385.03%
jan 1, 2012
28.158 mln
-9.645 mln
-25.51%
jan 1, 2013
41.059 mln
+12.901 mln
45.81%
jan 1, 2014
65.065 mln
+24.006 mln
58.47%
jan 1, 2015
30.609 mln
-34.456 mln
-52.96%
jan 1, 2016
38.515 mln
+7.905 mln
25.83%
Ranking of countries by current statistics by years