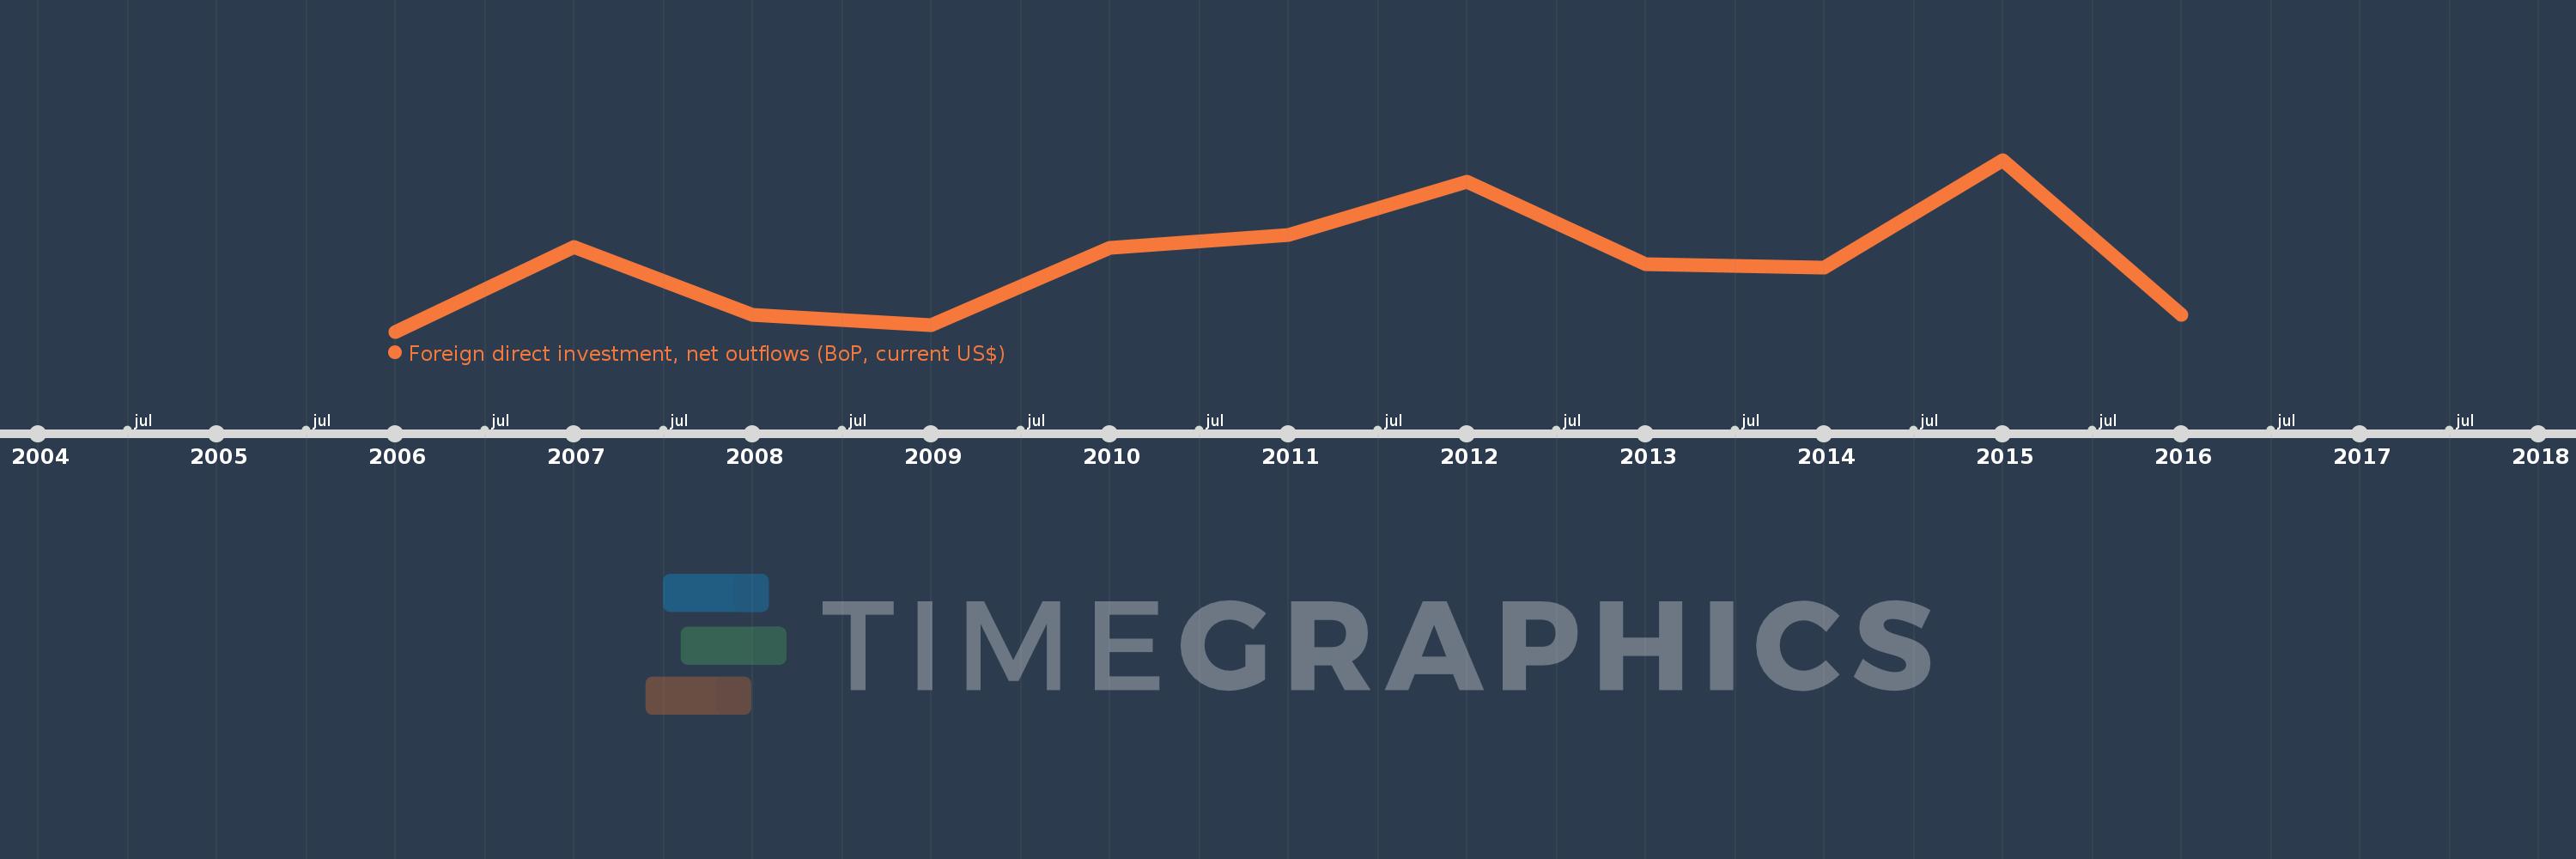
This timeline shows a graph from 2006 to 2016 of Mongolia. No data until 2005. Number of actual observations by date: 11.
Source name:
World Development Indicators
Source organization:
International Monetary Fund, Balance of Payments database, supplemented by data from the United Nations Conference on Trade and Development and official national sources.
Categories, topics:
Economy & Growth, Financial Sector
Last updated:
apr 23, 2017
Indicators value changes by year
Meaning:
44.709 mln
Minimum:
2.3 mln
jan 1, 2006
Maximum:
107.935 mln
jan 1, 2015
At the date of observation
Value
Absolute change
Change from the previous value
jan 1, 2006
2.3 mln
+2.3 mln
0.0%
jan 1, 2007
54.4 mln
+52.1 mln
2.27K%
jan 1, 2008
12.751 mln
-41.649 mln
-76.56%
jan 1, 2009
6.243 mln
-6.508 mln
-51.04%
jan 1, 2010
53.806 mln
+47.563 mln
761.92%
jan 1, 2011
61.726 mln
+7.921 mln
14.72%
jan 1, 2012
94.49 mln
+32.764 mln
53.08%
jan 1, 2013
44.005 mln
-50.485 mln
-53.43%
jan 1, 2014
41.463 mln
-2.541 mln
-5.78%
jan 1, 2015
107.935 mln
+66.472 mln
160.31%
jan 1, 2016
12.684 mln
-95.252 mln
-88.25%
Ranking of countries by current statistics by years