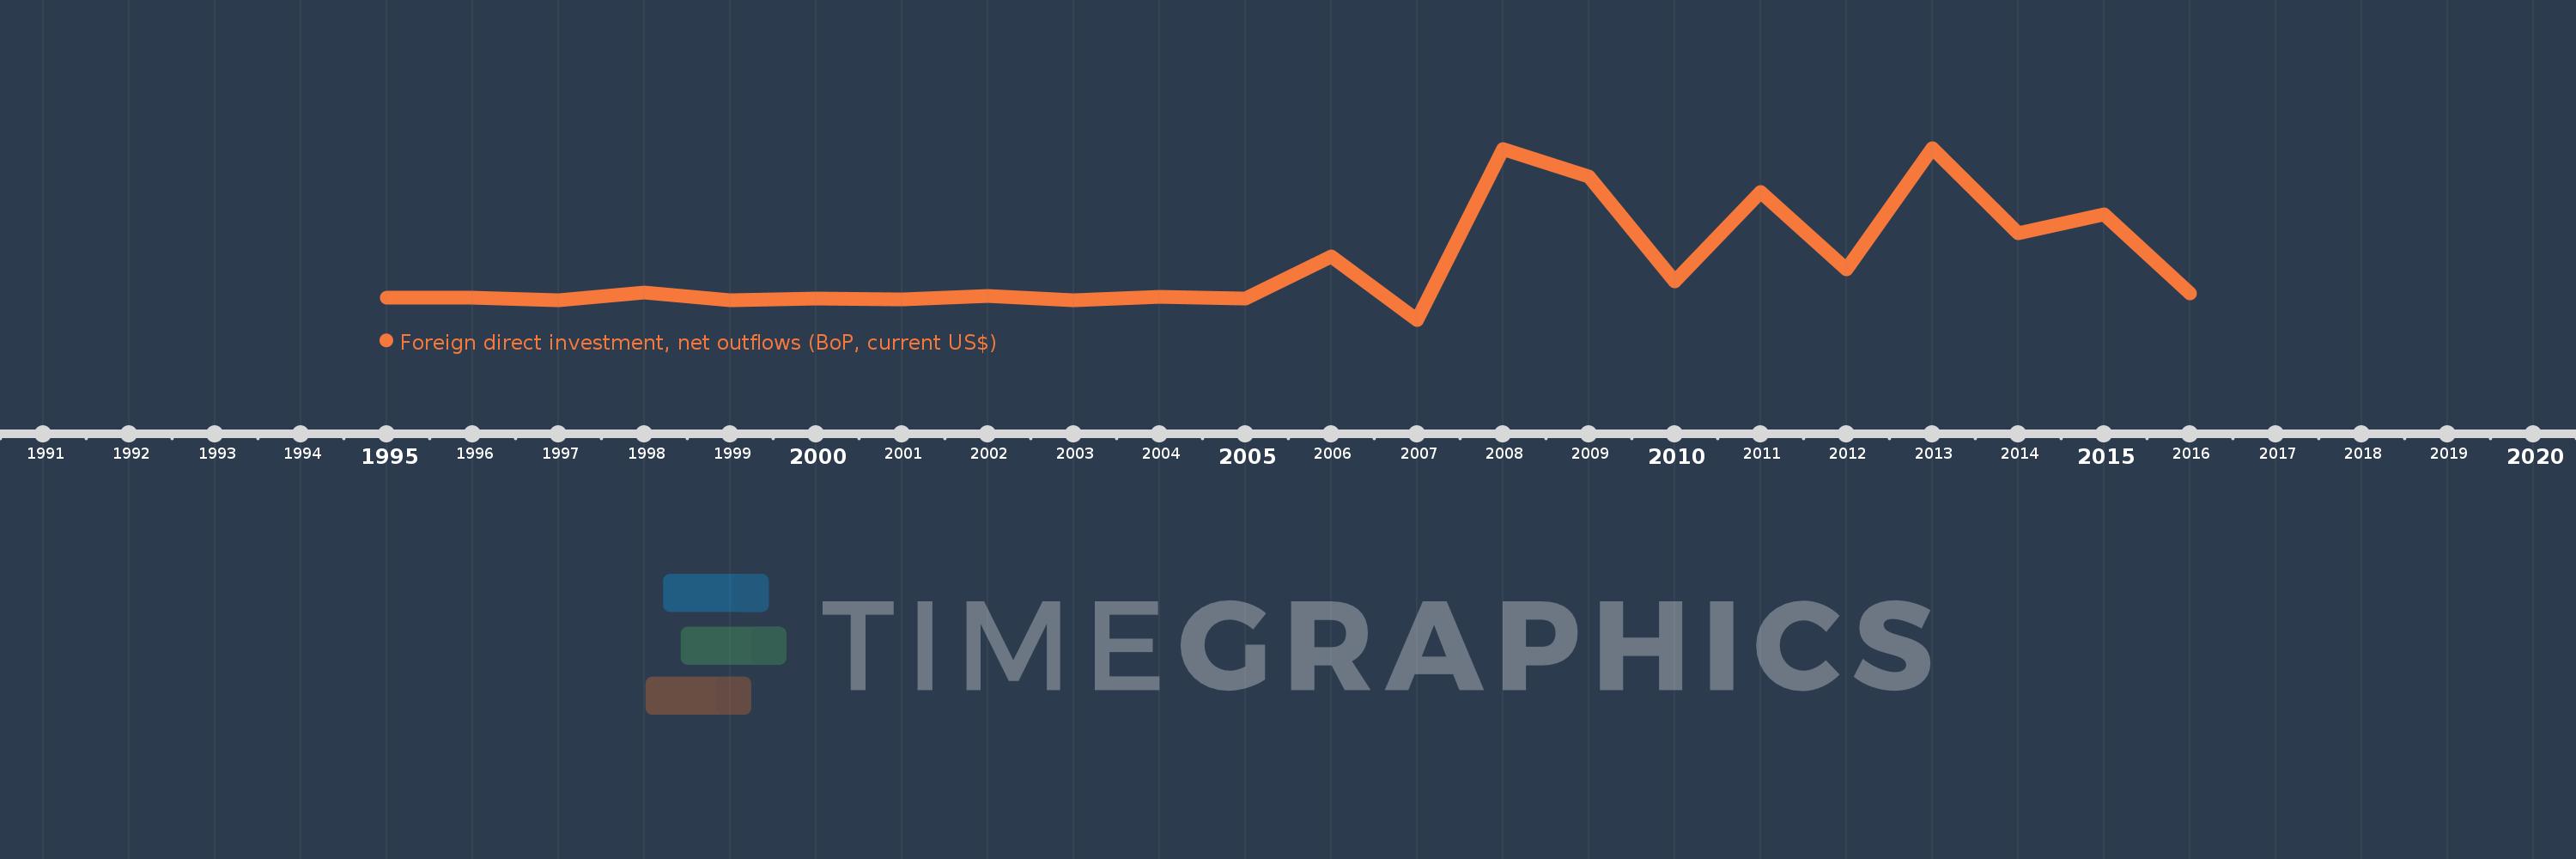
This timeline shows a graph from 1995 to 2016 of Ukraine. No data until 1994. Number of actual observations by date: 22.
Source name:
World Development Indicators
Source organization:
International Monetary Fund, Balance of Payments database, supplemented by data from the United Nations Conference on Trade and Development and official national sources.
Categories, topics:
Economy & Growth, Financial Sector
Last updated:
apr 23, 2017
Indicators value changes by year
Meaning:
227.409 mln
Minimum:
-133.0 mln
jan 1, 2007
Maximum:
980.0 mln
jan 1, 2013
At the date of observation
Value
Absolute change
Change from the previous value
jan 1, 1995
8.0 mln
+8.0 mln
0.0%
jan 1, 1996
10.0 mln
+2.0 mln
25.0%
jan 1, 1997
-5.0 mln
-15.0 mln
-150.0%
jan 1, 1998
42.0 mln
+47.0 mln
-940.0%
jan 1, 1999
-4.0 mln
-46.0 mln
-109.52%
jan 1, 2000
7.0 mln
+11.0 mln
-275.0%
jan 1, 2001
1000.0K
-6.0 mln
-85.71%
jan 1, 2002
23.0 mln
+22.0 mln
2.2K%
jan 1, 2003
-5.0 mln
-28.0 mln
-121.74%
jan 1, 2004
13.0 mln
+18.0 mln
-360.0%
jan 1, 2005
4.0 mln
-9.0 mln
-69.23%
jan 1, 2006
275.0 mln
+271.0 mln
6.78K%
jan 1, 2007
-133.0 mln
-408.0 mln
-148.36%
jan 1, 2008
975.0 mln
+1.108 bln
-833.08%
jan 1, 2009
797.0 mln
-178.0 mln
-18.26%
jan 1, 2010
115.0 mln
-682.0 mln
-85.57%
jan 1, 2011
692.0 mln
+577.0 mln
501.74%
jan 1, 2012
192.0 mln
-500.0 mln
-72.25%
jan 1, 2013
980.0 mln
+788.0 mln
410.42%
jan 1, 2014
430.0 mln
-550.0 mln
-56.12%
jan 1, 2015
548.0 mln
+118.0 mln
27.44%
jan 1, 2016
38.0 mln
-510.0 mln
-93.07%
Ranking of countries by current statistics by years