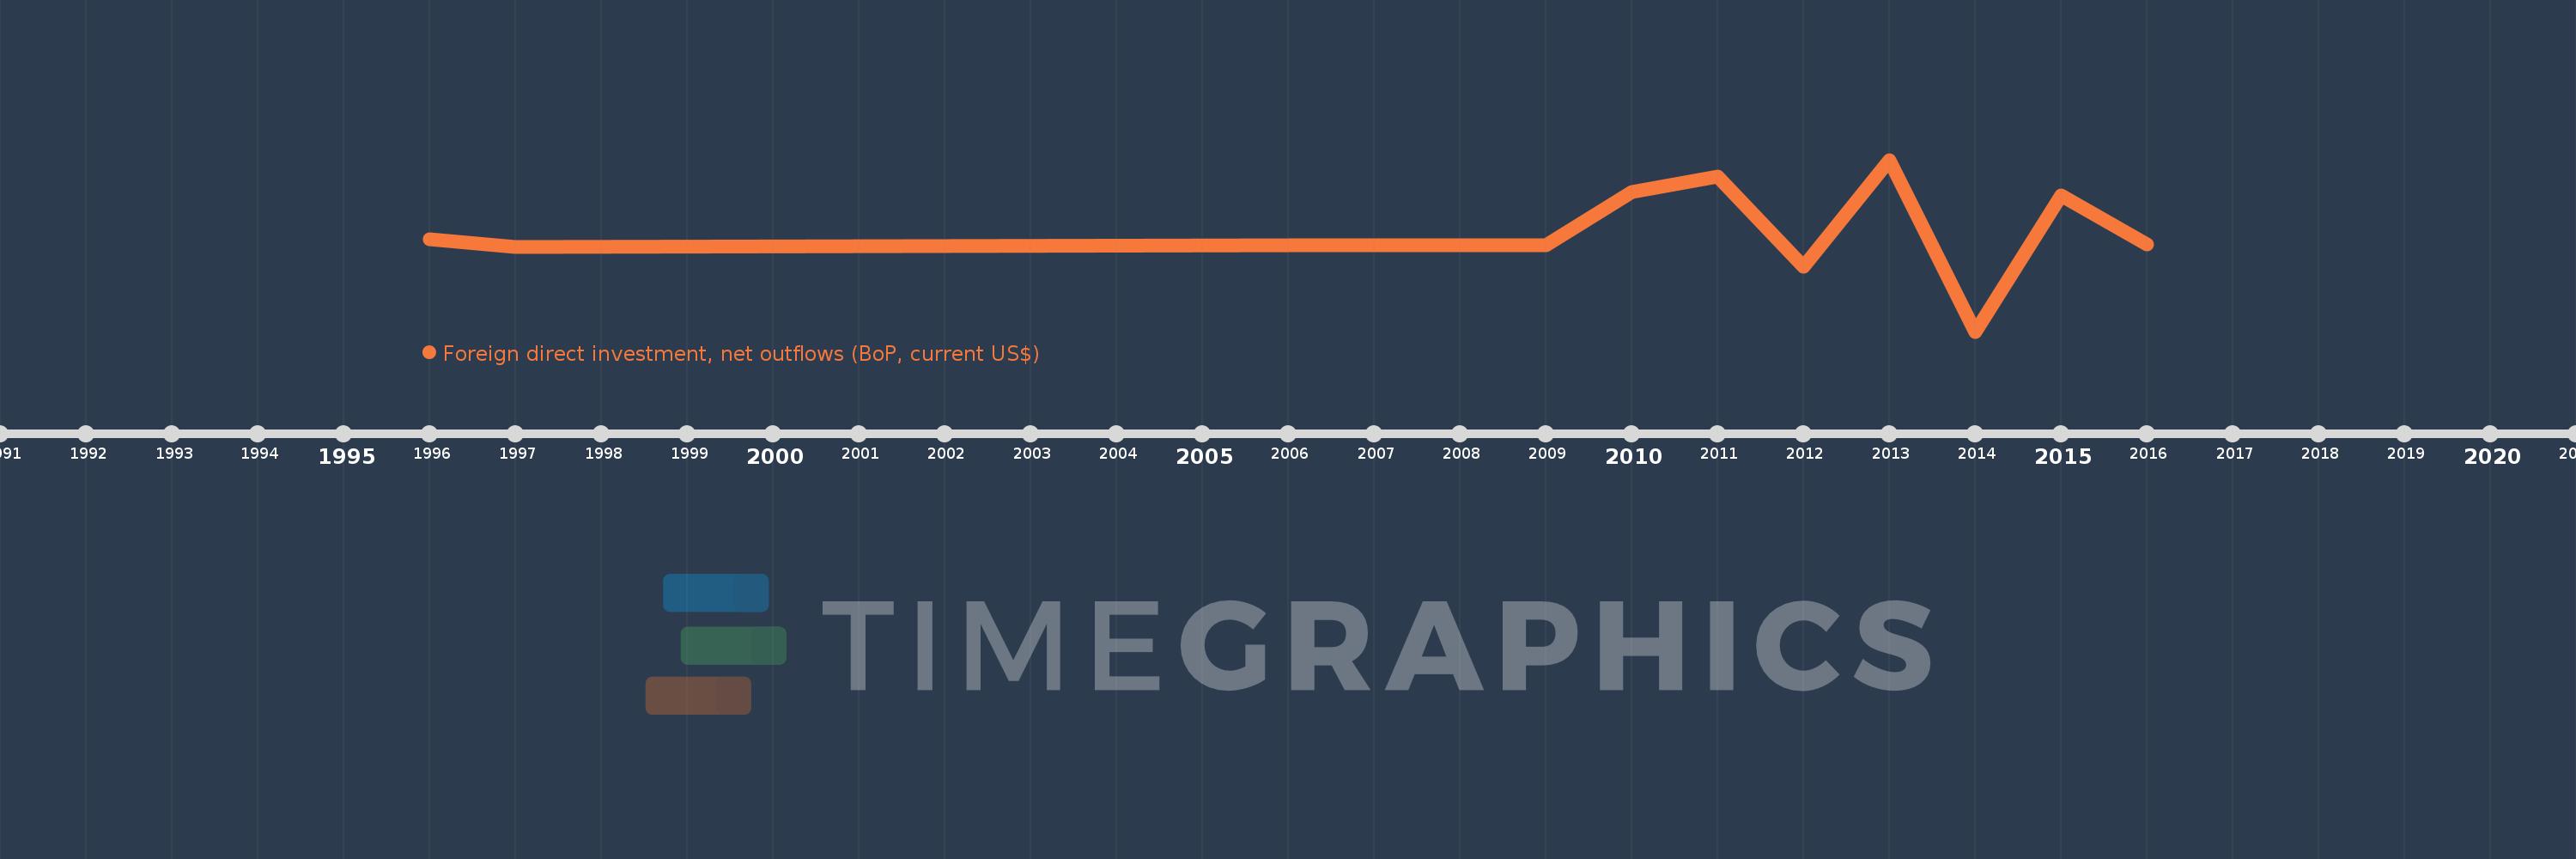
This timeline shows a graph from 1996 to 2016 of Uganda. No data until 1995. Number of actual observations by date: 13.
Source name:
World Development Indicators
Source organization:
International Monetary Fund, Balance of Payments database, supplemented by data from the United Nations Conference on Trade and Development and official national sources.
Categories, topics:
Economy & Growth, Financial Sector
Last updated:
apr 23, 2017
Indicators value changes by year
Meaning:
6.378 mln
Minimum:
-47.207 mln
jan 1, 2014
Maximum:
46.337 mln
jan 1, 2013
At the date of observation
Value
Absolute change
Change from the previous value
jan 1, 1996
3.294 mln
+3.294 mln
0.0%
jan 1, 1997
-1.028 mln
-4.322 mln
-131.22%
jan 1, 2006
0.0
+1.028 mln
-100.0%
jan 1, 2007
0.0
0.0
%
jan 1, 2008
0.0
0.0
%
jan 1, 2009
0.0
0.0
%
jan 1, 2010
28.85 mln
+28.85 mln
%
jan 1, 2011
37.214 mln
+8.364 mln
28.99%
jan 1, 2012
-11.847 mln
-49.061 mln
-131.83%
jan 1, 2013
46.337 mln
+58.184 mln
-491.14%
jan 1, 2014
-47.207 mln
-93.544 mln
-201.88%
jan 1, 2015
27.018 mln
+74.226 mln
-157.23%
jan 1, 2016
285.701K
-26.733 mln
-98.94%
Ranking of countries by current statistics by years