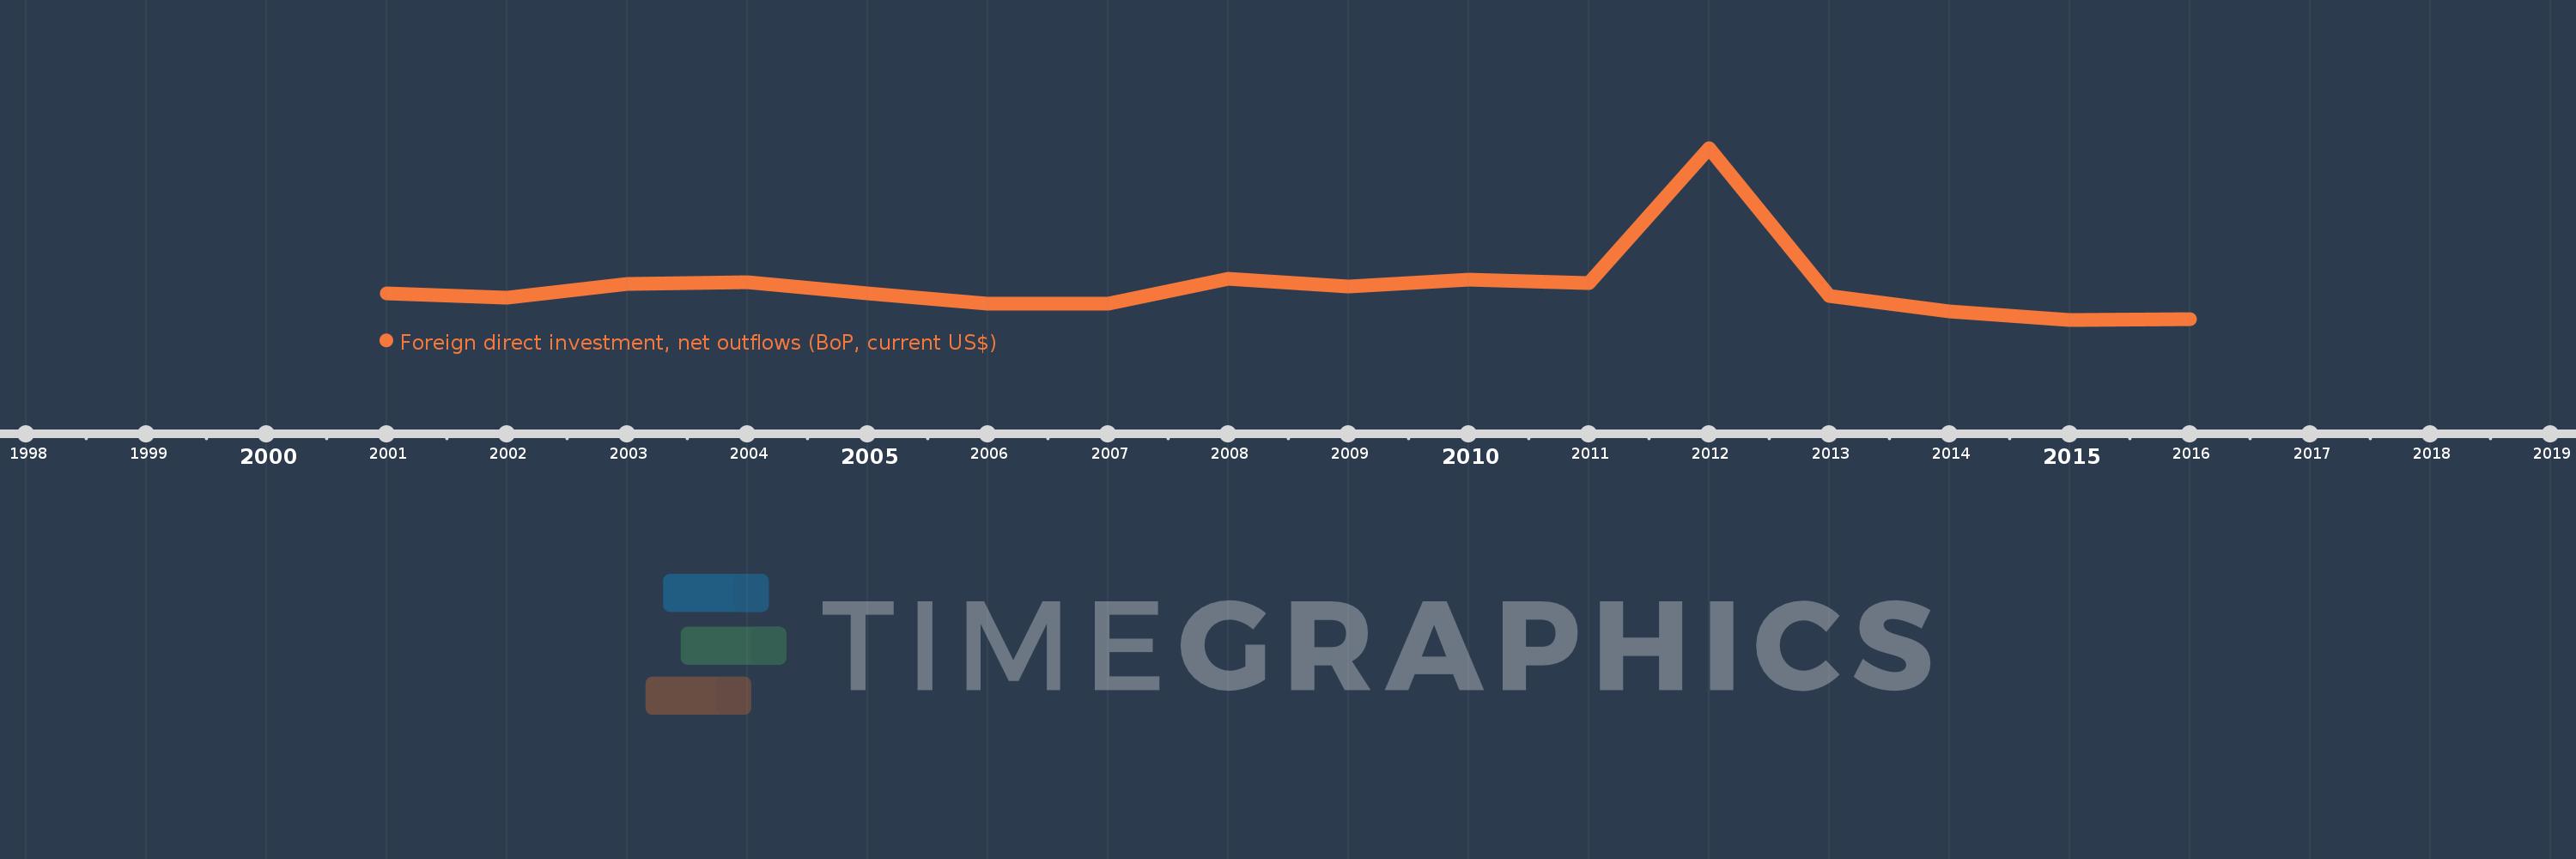
This timeline shows a graph from 2001 to 2016 of St. Lucia. No data until 2000. Number of actual observations by date: 16.
Source name:
World Development Indicators
Source organization:
International Monetary Fund, Balance of Payments database, supplemented by data from the United Nations Conference on Trade and Development and official national sources.
Categories, topics:
Economy & Growth, Financial Sector
Last updated:
apr 23, 2017
Indicators value changes by year
Meaning:
5.05 mln
Minimum:
2.506 mln
jan 1, 2015
Maximum:
15.556 mln
jan 1, 2012
At the date of observation
Value
Absolute change
Change from the previous value
jan 1, 2001
4.496 mln
+4.496 mln
0.0%
jan 1, 2002
4.181 mln
-314.815K
-7.0%
jan 1, 2003
5.211 mln
+1.03 mln
24.62%
jan 1, 2004
5.389 mln
+177.778K
3.41%
jan 1, 2005
4.522 mln
-867.085K
-16.09%
jan 1, 2006
3.749 mln
-773.189K
-17.1%
jan 1, 2007
3.72 mln
-28.774K
-0.77%
jan 1, 2008
5.609 mln
+1.889 mln
50.78%
jan 1, 2009
5.028 mln
-581.026K
-10.36%
jan 1, 2010
5.536 mln
+508.577K
10.12%
jan 1, 2011
5.307 mln
-229.619K
-4.15%
jan 1, 2012
15.556 mln
+10.249 mln
193.13%
jan 1, 2013
4.329 mln
-11.227 mln
-72.17%
jan 1, 2014
3.132 mln
-1.197 mln
-27.65%
jan 1, 2015
2.506 mln
-626.296K
-20.0%
jan 1, 2016
2.53 mln
+24.815K
0.99%
Ranking of countries by current statistics by years