33
/
AIzaSyAYiBZKx7MnpbEhh9jyipgxe19OcubqV5w
August 1, 2025
182063
Luxembourg
LUX
true
2
1
Foreign direct investment, net outflows (BoP, current US$)
2016,2015,2014,2013,2012,2011,2010,2009,2008,2007,2006,2005,2004,2003
Download
Global statistics library →Luxembourg →

Foreign direct investment, net outflows (BoP, current US$)

This statistics in other country:

AfghanistanAlbaniaAlgeriaAngolaAntigua and BarbudaArab WorldArgentinaArmeniaArubaAustraliaAustriaAzerbaijanBahamas, TheBahrainBangladeshBarbadosBelarusBelgiumBelizeBeninBermudaBoliviaBosnia and HerzegovinaBotswanaBrazilBritish Virgin IslandsBrunei DarussalamBulgariaBurkina FasoBurundiCabo VerdeCambodiaCameroonCanadaCaribbean small statesCayman IslandsCentral African RepublicCentral Europe and the BalticsChadChileChinaColombiaComorosCongo, Dem. Rep.Congo, Rep.Costa RicaCote d'IvoireCroatiaCuracaoCyprusCzech RepublicDenmarkDominicaDominican RepublicEarly-demographic dividendEast Asia & PacificEast Asia & Pacific (excluding high income)East Asia & Pacific (IDA & IBRD countries)EcuadorEgypt, Arab Rep.El SalvadorEquatorial GuineaEritreaEstoniaEuro areaEurope & Central AsiaEurope & Central Asia (excluding high income)Europe & Central Asia (IDA & IBRD countries)European UnionFijiFinlandFragile and conflict affected situationsFranceFrench PolynesiaGabonGambia, TheGeorgiaGermanyGhanaGreeceGrenadaGuatemalaGuineaGuinea-BissauGuyanaHaitiHeavily indebted poor countries (HIPC)High incomeHondurasHong Kong SAR, ChinaHungaryIBRD onlyIcelandIDA & IBRD totalIDA blendIDA onlyIDA totalIndiaIndonesiaIran, Islamic Rep.IraqIrelandIsraelItalyJamaicaJapanJordanKazakhstanKenyaKiribatiKorea, Dem. People’s Rep.Korea, Rep.KosovoKuwaitKyrgyz RepublicLao PDRLate-demographic dividendLatin America & Caribbean Latin America & Caribbean (excluding high income)Latin America & the Caribbean (IDA & IBRD countries)LatviaLeast developed countries: UN classificationLebanonLesothoLiberiaLibyaLithuaniaLow & middle incomeLow incomeLower middle incomeLuxembourgMacao SAR, ChinaMacedonia, FYRMadagascarMalawiMalaysiaMaliMaltaMarshall IslandsMauritaniaMauritiusMexicoMicronesia, Fed. Sts.Middle East & North AfricaMiddle East & North Africa (excluding high income)Middle East & North Africa (IDA & IBRD countries)Middle incomeMoldovaMongoliaMontenegroMoroccoMozambiqueNamibiaNauruNetherlandsNew CaledoniaNew ZealandNicaraguaNigerNigeriaNorth AmericaNorthern Mariana IslandsNorwayOECD membersOmanOther small statesPacific island small statesPakistanPalauPanamaPapua New GuineaParaguayPeruPhilippinesPolandPortugalPost-demographic dividendPre-demographic dividendQatarRomaniaRussian FederationRwandaSamoaSao Tome and PrincipeSaudi ArabiaSenegalSerbiaSeychellesSierra LeoneSingaporeSint Maarten (Dutch part)Slovak RepublicSloveniaSmall statesSolomon IslandsSouth AfricaSouth AsiaSouth Asia (IDA & IBRD)SpainSri LankaSt. Kitts and NevisSt. LuciaSt. Vincent and the GrenadinesSub-Saharan Africa Sub-Saharan Africa (excluding high income)Sub-Saharan Africa (IDA & IBRD countries)SurinameSwazilandSwedenSwitzerlandSyrian Arab RepublicTajikistanTanzaniaThailandTimor-LesteTogoTongaTrinidad and TobagoTunisiaTurkeyUgandaUkraineUnited Arab EmiratesUnited KingdomUnited StatesUpper middle incomeUruguayVanuatuVenezuela, RBVietnamWest Bank and GazaWorldYemen, Rep.ZambiaZimbabwe

Timeline:

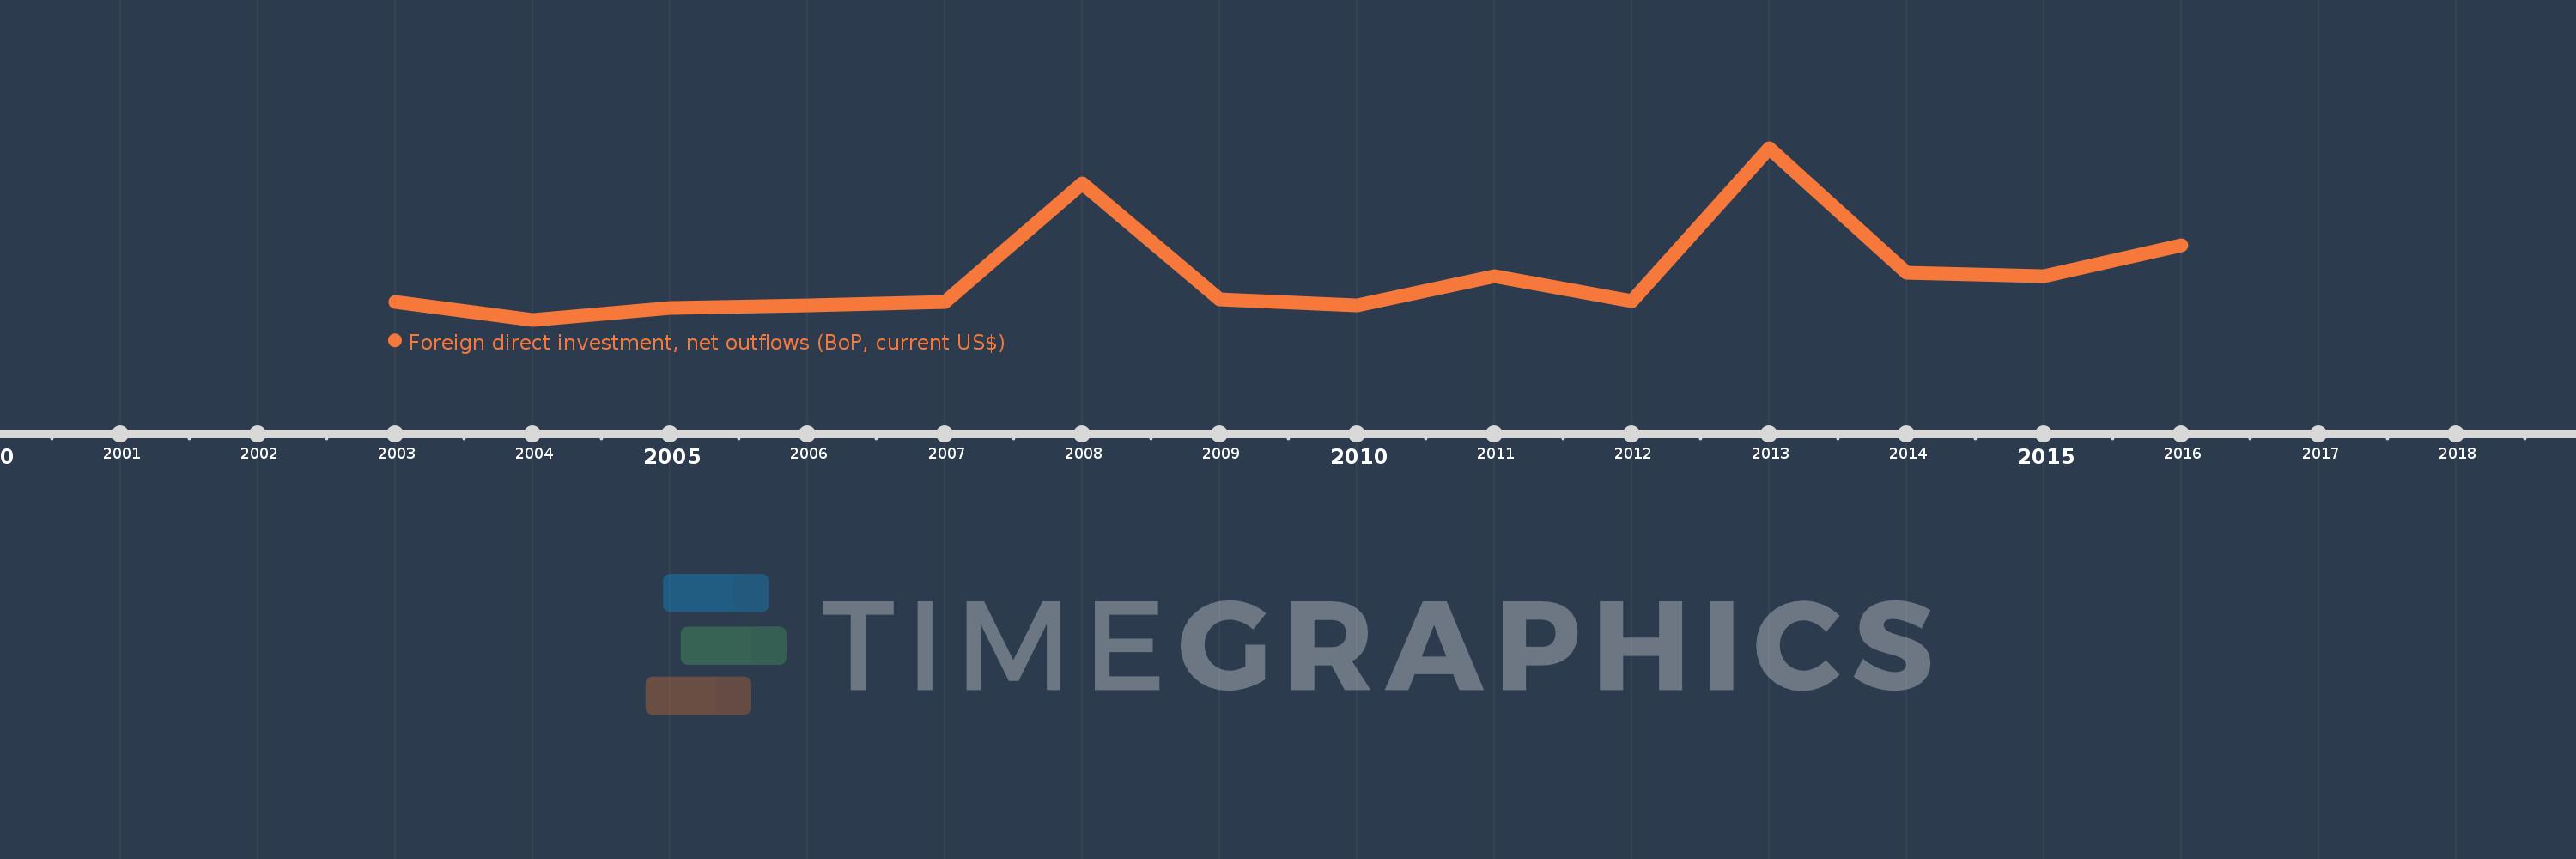
This timeline shows a graph from 2003 to 2016 of Luxembourg. No data until 2002. Number of actual observations by date: 14.

Source name:

World Development Indicators

Source organization:

International Monetary Fund, Balance of Payments database, supplemented by data from the United Nations Conference on Trade and Development and official national sources.

Categories, topics:

Economy & Growth, Financial Sector

Last updated:

apr 23, 2017

Indicators value changes by year

Meaning:
24.216 bln
Minimum:
850.696 mln
jan 1, 2004
Maximum:
89.806 bln
jan 1, 2013
At the date of observation
Value
Absolute change
Change from the previous value
jan 1, 2003
10.217 bln
+10.217 bln
0.0%
jan 1, 2004
850.696 mln
-9.367 bln
-91.67%
jan 1, 2005
6.773 bln
+5.922 bln
696.19%
jan 1, 2006
8.211 bln
+1.438 bln
21.23%
jan 1, 2007
10.035 bln
+1.824 bln
22.21%
jan 1, 2008
71.294 bln
+61.259 bln
610.45%
jan 1, 2009
11.506 bln
-59.788 bln
-83.86%
jan 1, 2010
8.268 bln
-3.238 bln
-28.14%
jan 1, 2011
23.253 bln
+14.984 bln
181.23%
jan 1, 2012
10.716 bln
-12.537 bln
-53.92%
jan 1, 2013
89.806 bln
+79.09 bln
738.07%
jan 1, 2014
25.283 bln
-64.523 bln
-71.85%
jan 1, 2015
23.437 bln
-1.846 bln
-7.3%
jan 1, 2016
39.371 bln
+15.934 bln
67.99%

Ranking of countries by current statistics by years