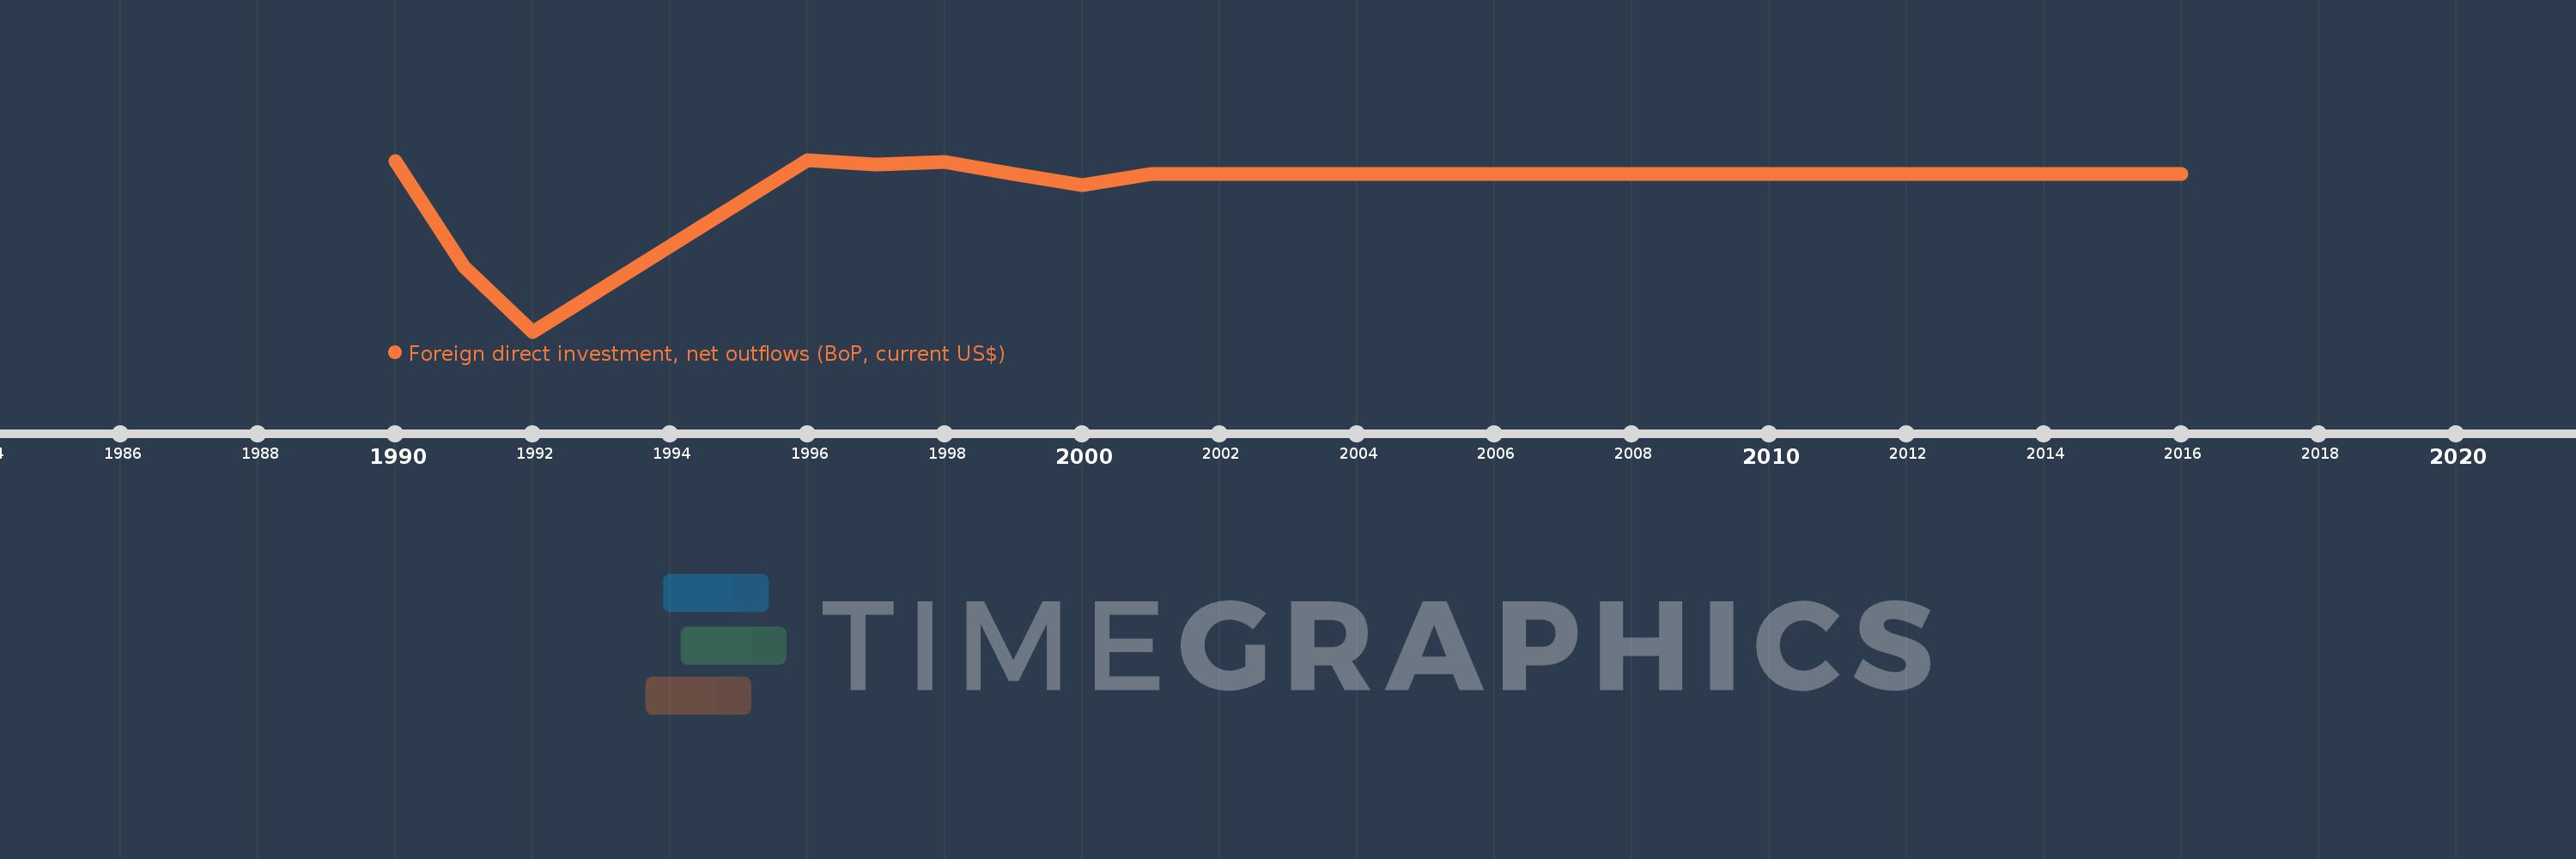
This timeline shows a graph from 1990 to 2016 of Haiti. No data until 1989. Number of actual observations by date: 20.
Source name:
World Development Indicators
Source organization:
International Monetary Fund, Balance of Payments database, supplemented by data from the United Nations Conference on Trade and Development and official national sources.
Categories, topics:
Economy & Growth, Financial Sector
Last updated:
apr 23, 2017
Indicators value changes by year
Meaning:
-924.899K
Minimum:
-13.6 mln
jan 1, 1992
Maximum:
1.2 mln
jan 1, 1996
At the date of observation
Value
Absolute change
Change from the previous value
jan 1, 1990
1.097 mln
+1.097 mln
0.0%
jan 1, 1991
-8.0 mln
-9.097 mln
-829.16%
jan 1, 1992
-13.6 mln
-5.6 mln
70.0%
jan 1, 1996
1.2 mln
+14.8 mln
-108.83%
jan 1, 1997
804.516K
-395.826K
-32.98%
jan 1, 1998
1000.0K
+195.484K
24.3%
jan 1, 1999
0.0
-1000.0K
-100.0%
jan 1, 2000
-1000.0K
-1000.0K
%
jan 1, 2001
0.0
+1000.0K
-100.0%
jan 1, 2006
0.0
0.0
%
jan 1, 2007
0.0
0.0
%
jan 1, 2008
0.0
0.0
%
jan 1, 2009
0.0
0.0
%
jan 1, 2010
0.0
0.0
%
jan 1, 2011
0.0
0.0
%
jan 1, 2012
0.0
0.0
%
jan 1, 2013
0.0
0.0
%
jan 1, 2014
0.0
0.0
%
jan 1, 2015
0.0
0.0
%
jan 1, 2016
0.0
0.0
%
Ranking of countries by current statistics by years