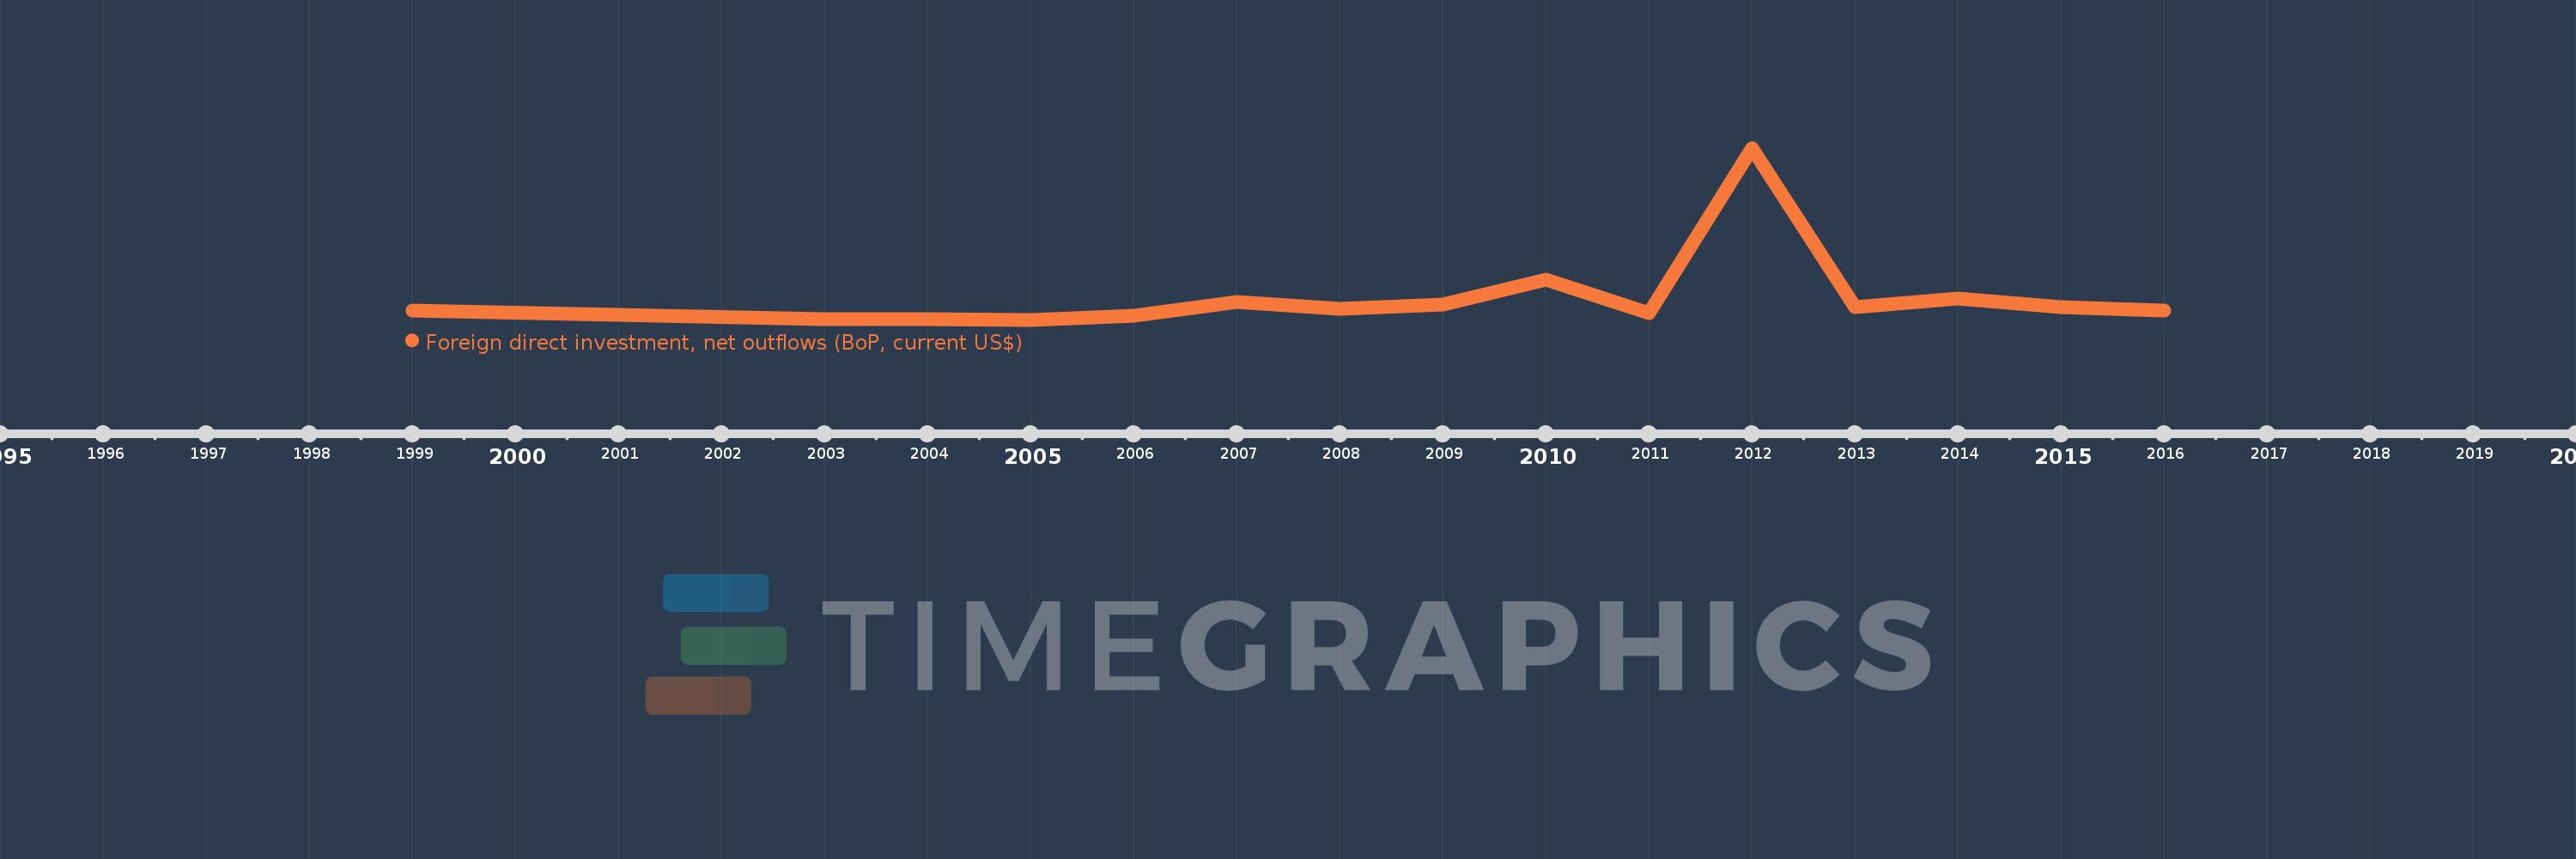
This timeline shows a graph from 1999 to 2016 of Armenia. No data until 1998. Number of actual observations by date: 15.
Source name:
World Development Indicators
Source organization:
International Monetary Fund, Balance of Payments database, supplemented by data from the United Nations Conference on Trade and Development and official national sources.
Categories, topics:
Economy & Growth, Financial Sector
Last updated:
apr 23, 2017
Indicators value changes by year
Meaning:
27.613 mln
Minimum:
-400.827K
jan 1, 2005
Maximum:
215.886 mln
jan 1, 2012
At the date of observation
Value
Absolute change
Change from the previous value
jan 1, 1999
11.546 mln
+11.546 mln
0.0%
jan 1, 2003
1.532K
-11.544 mln
-99.99%
jan 1, 2004
359.247K
+357.715K
23.35K%
jan 1, 2005
-400.827K
-760.074K
-211.57%
jan 1, 2006
4.896 mln
+5.296 mln
-1.32K%
jan 1, 2007
21.937 mln
+17.041 mln
348.1%
jan 1, 2008
13.787 mln
-8.149 mln
-37.15%
jan 1, 2009
18.688 mln
+4.901 mln
35.55%
jan 1, 2010
50.399 mln
+31.711 mln
169.69%
jan 1, 2011
7.945 mln
-42.454 mln
-84.24%
jan 1, 2012
215.886 mln
+207.941 mln
2.62K%
jan 1, 2013
15.803 mln
-200.083 mln
-92.68%
jan 1, 2014
26.574 mln
+10.771 mln
68.16%
jan 1, 2015
16.037 mln
-10.537 mln
-39.65%
jan 1, 2016
10.739 mln
-5.298 mln
-33.04%
Ranking of countries by current statistics by years